
| LandingLens | LandingLens on Snowflake |
|---|---|
Analyze Model Performance
Watch the following video to learn how to use the Performance Report and related tools to analyze and improve model performance.Adjust Threshold
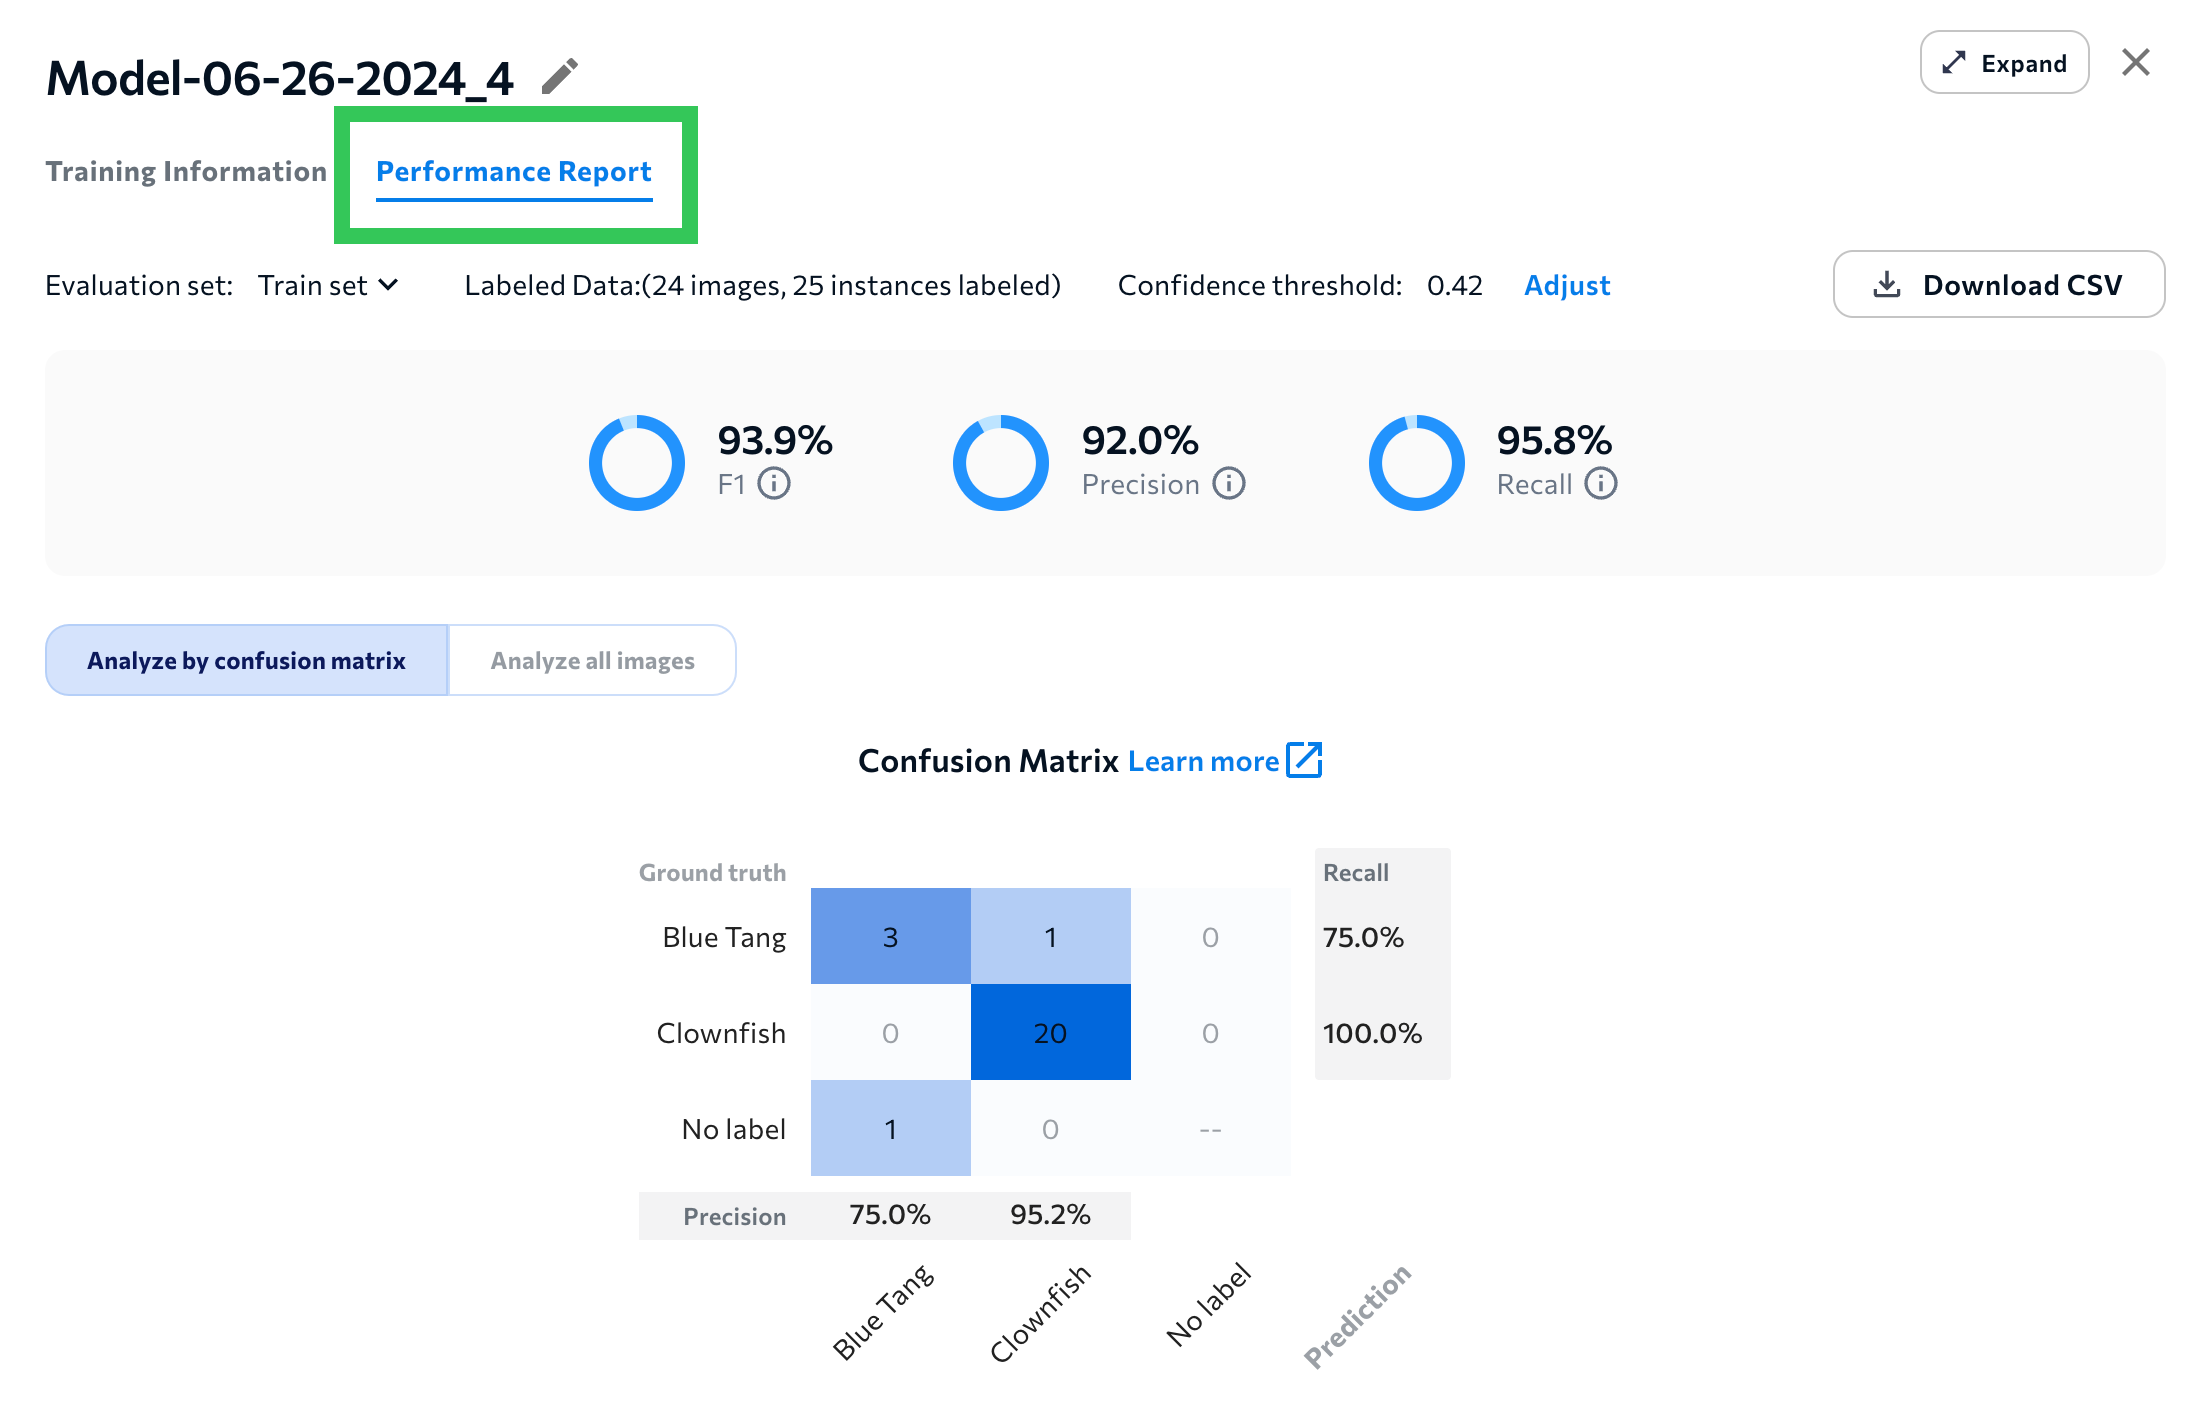
You can see how the model performs on the evaluation set with different Confidence Thresholds (for Object Detection and Segmentation) or Anomaly Thresholds (for Anomaly Detection). To do this:- Open the Performance Report.
- Click Adjust.
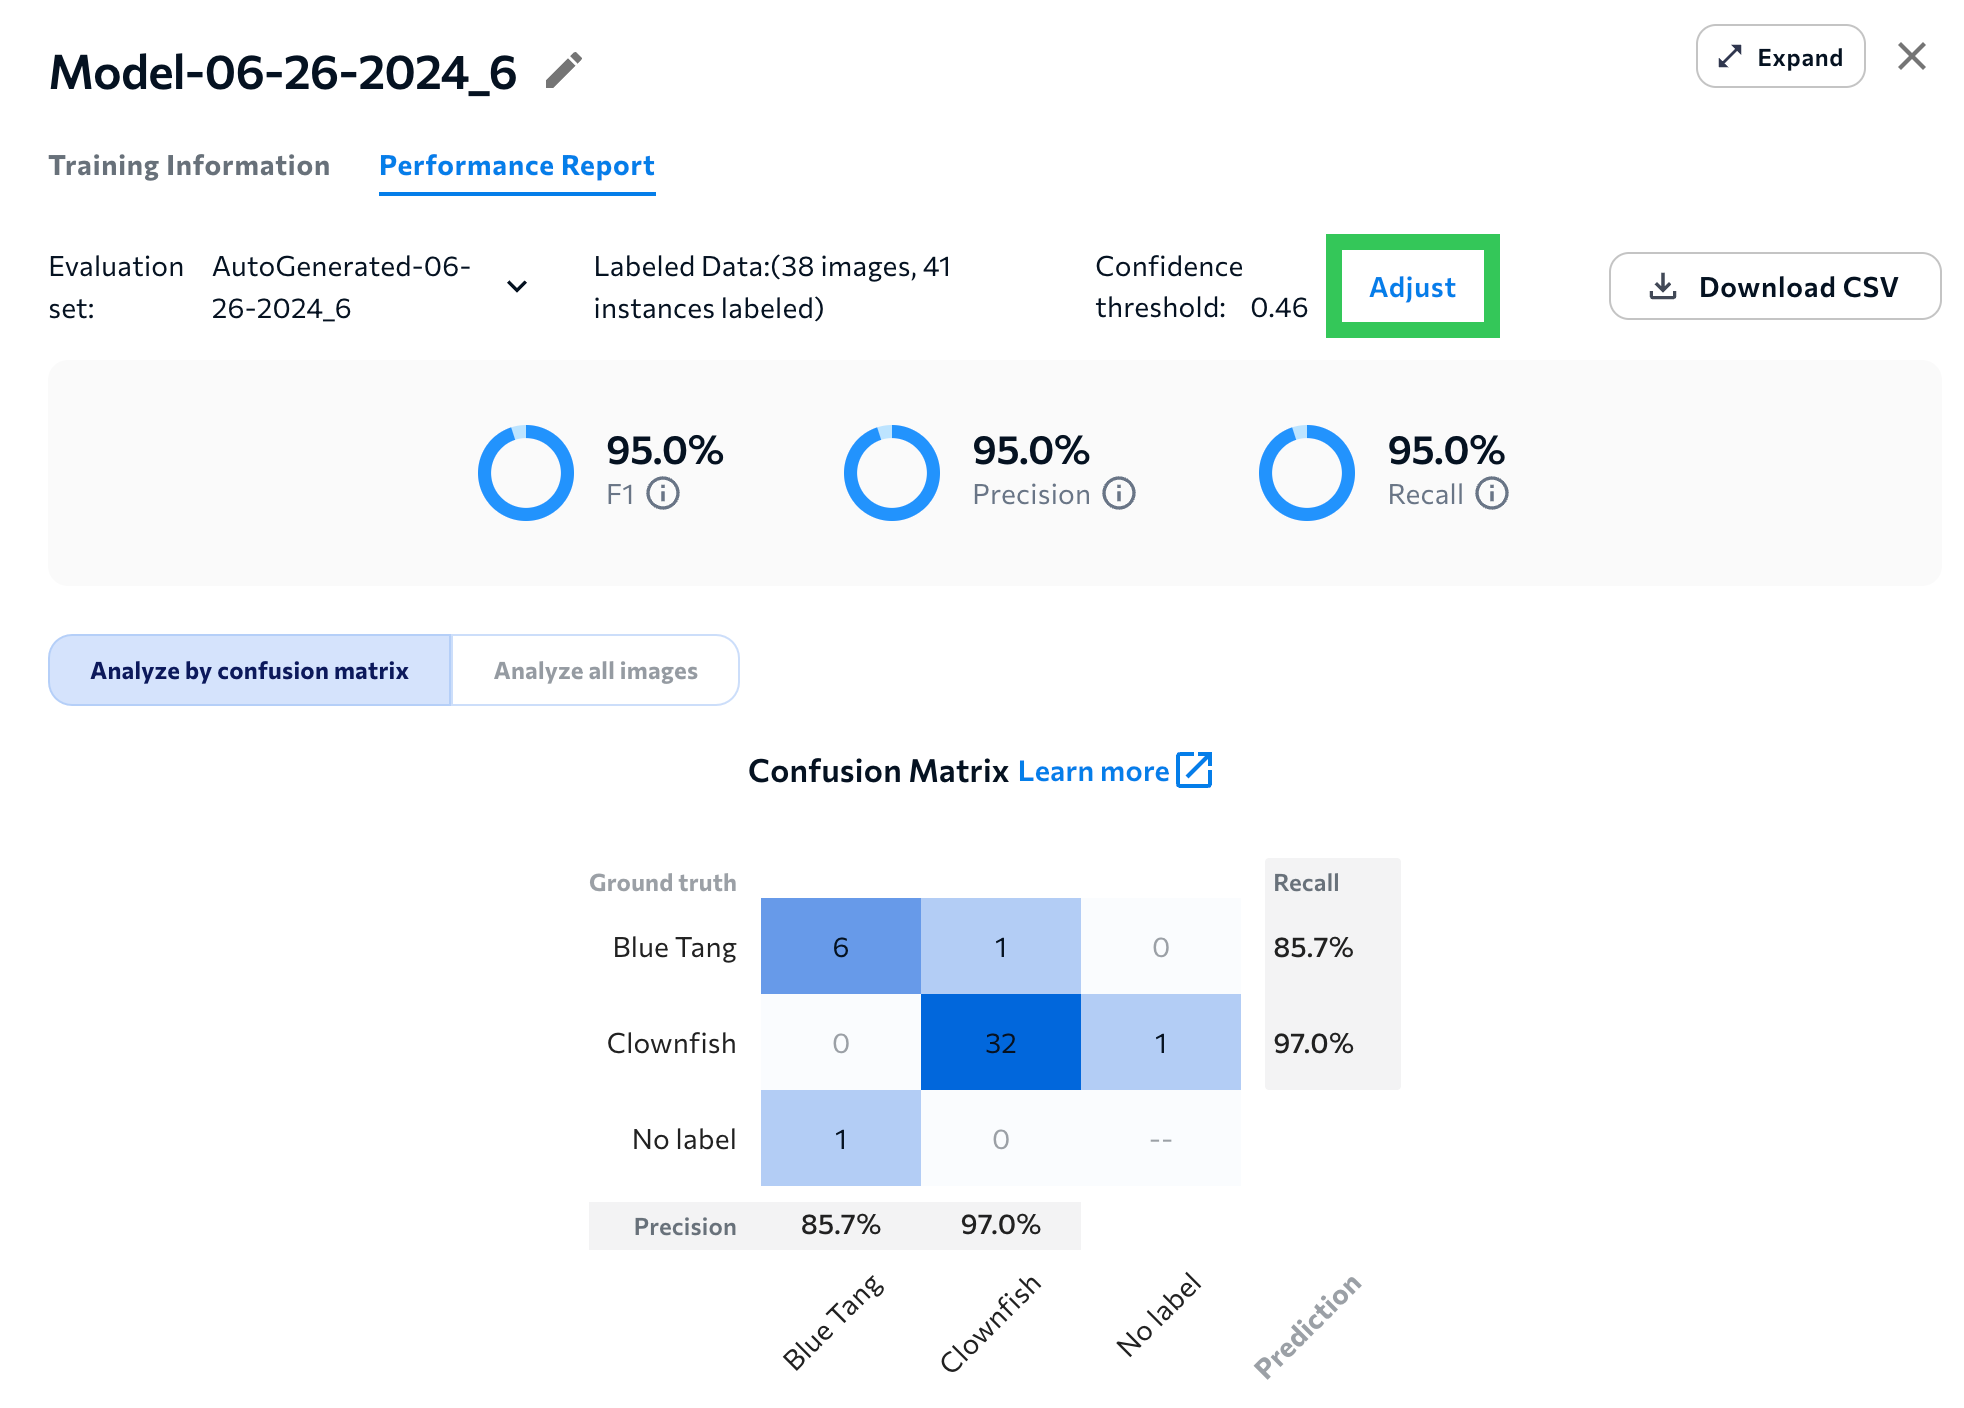
- Change the threshold by using the slider or by entering a value in the text box.
- If you want to see a full performance report for the selected threshold, click Generate a New Report.
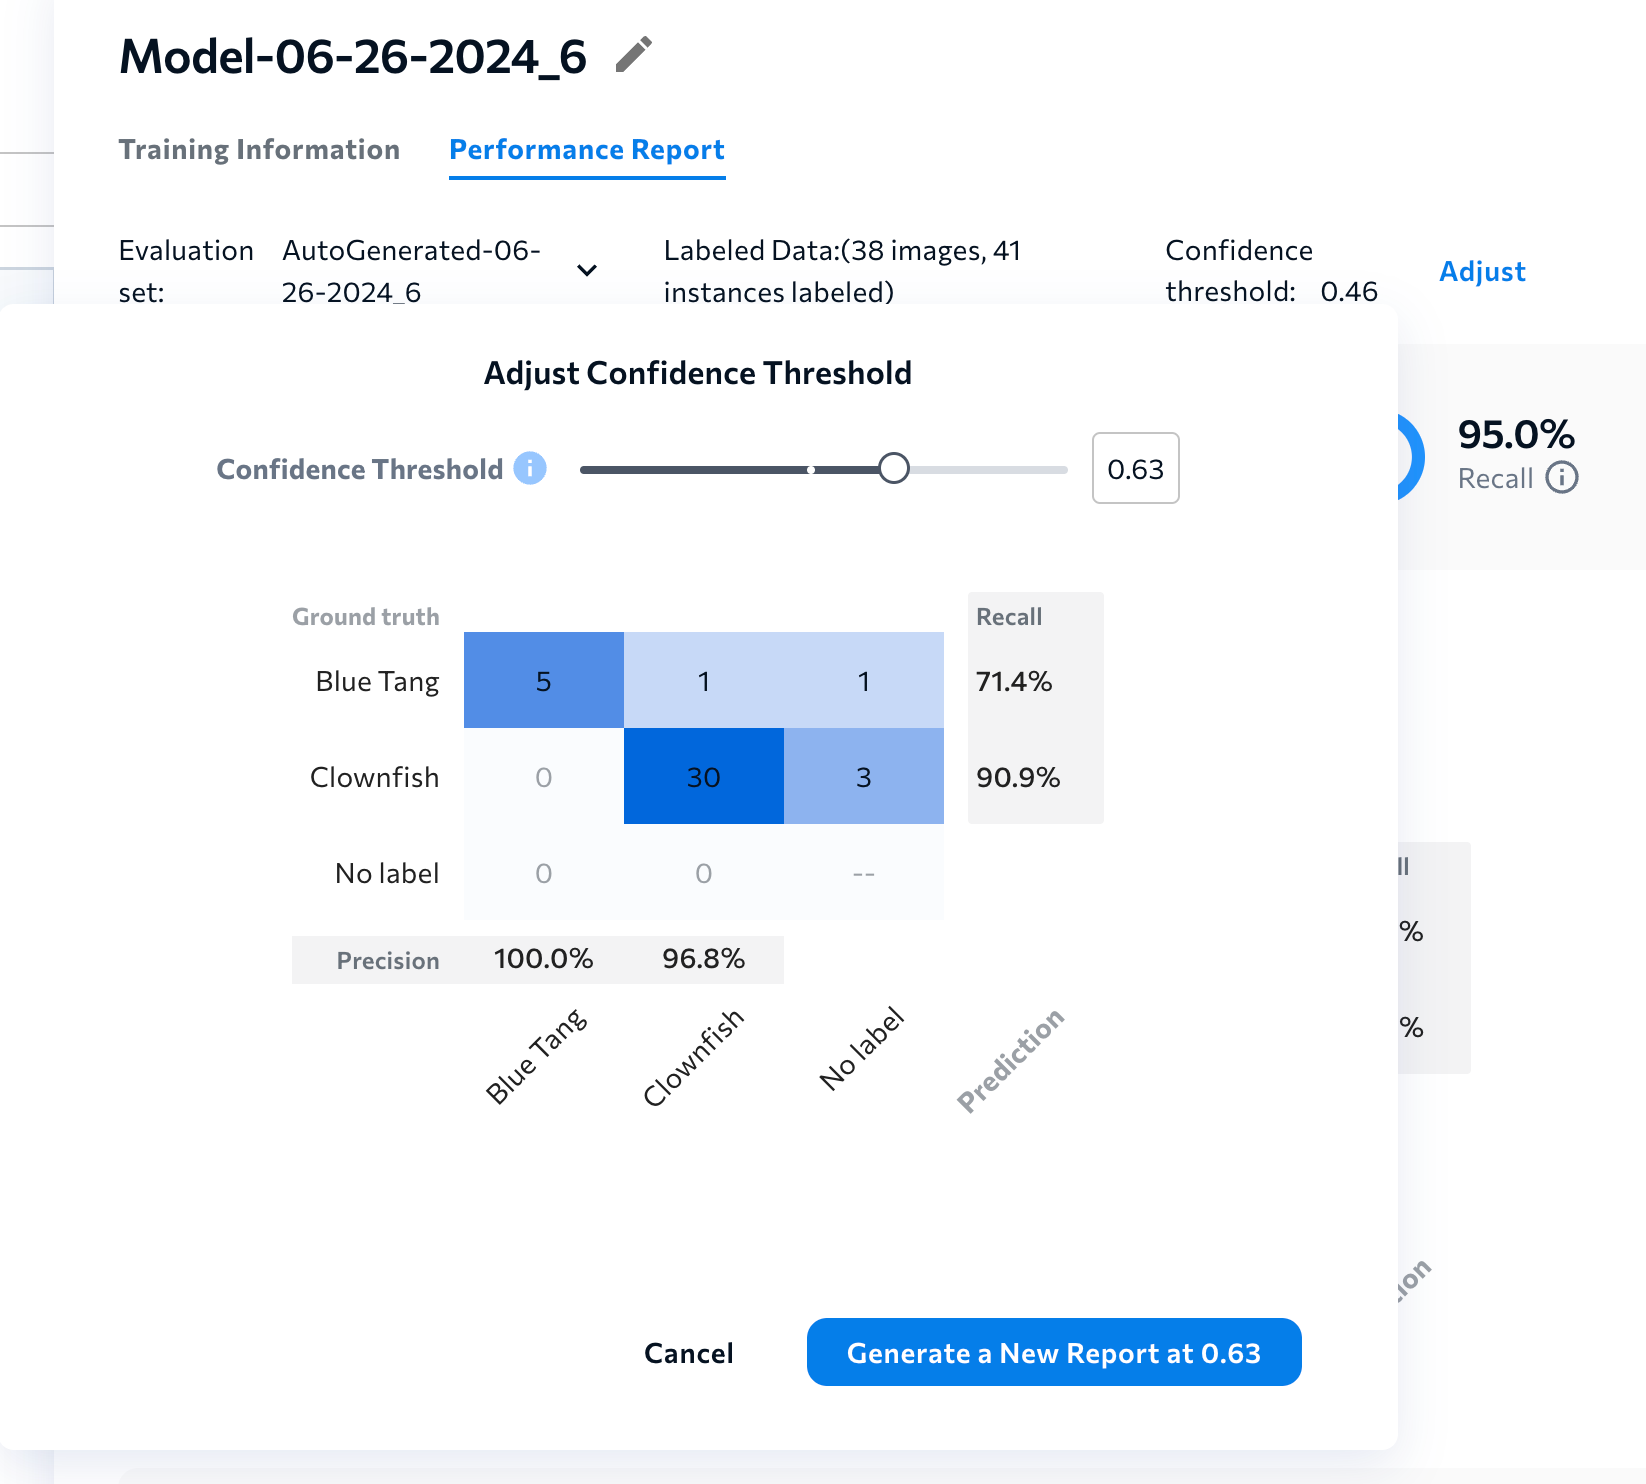
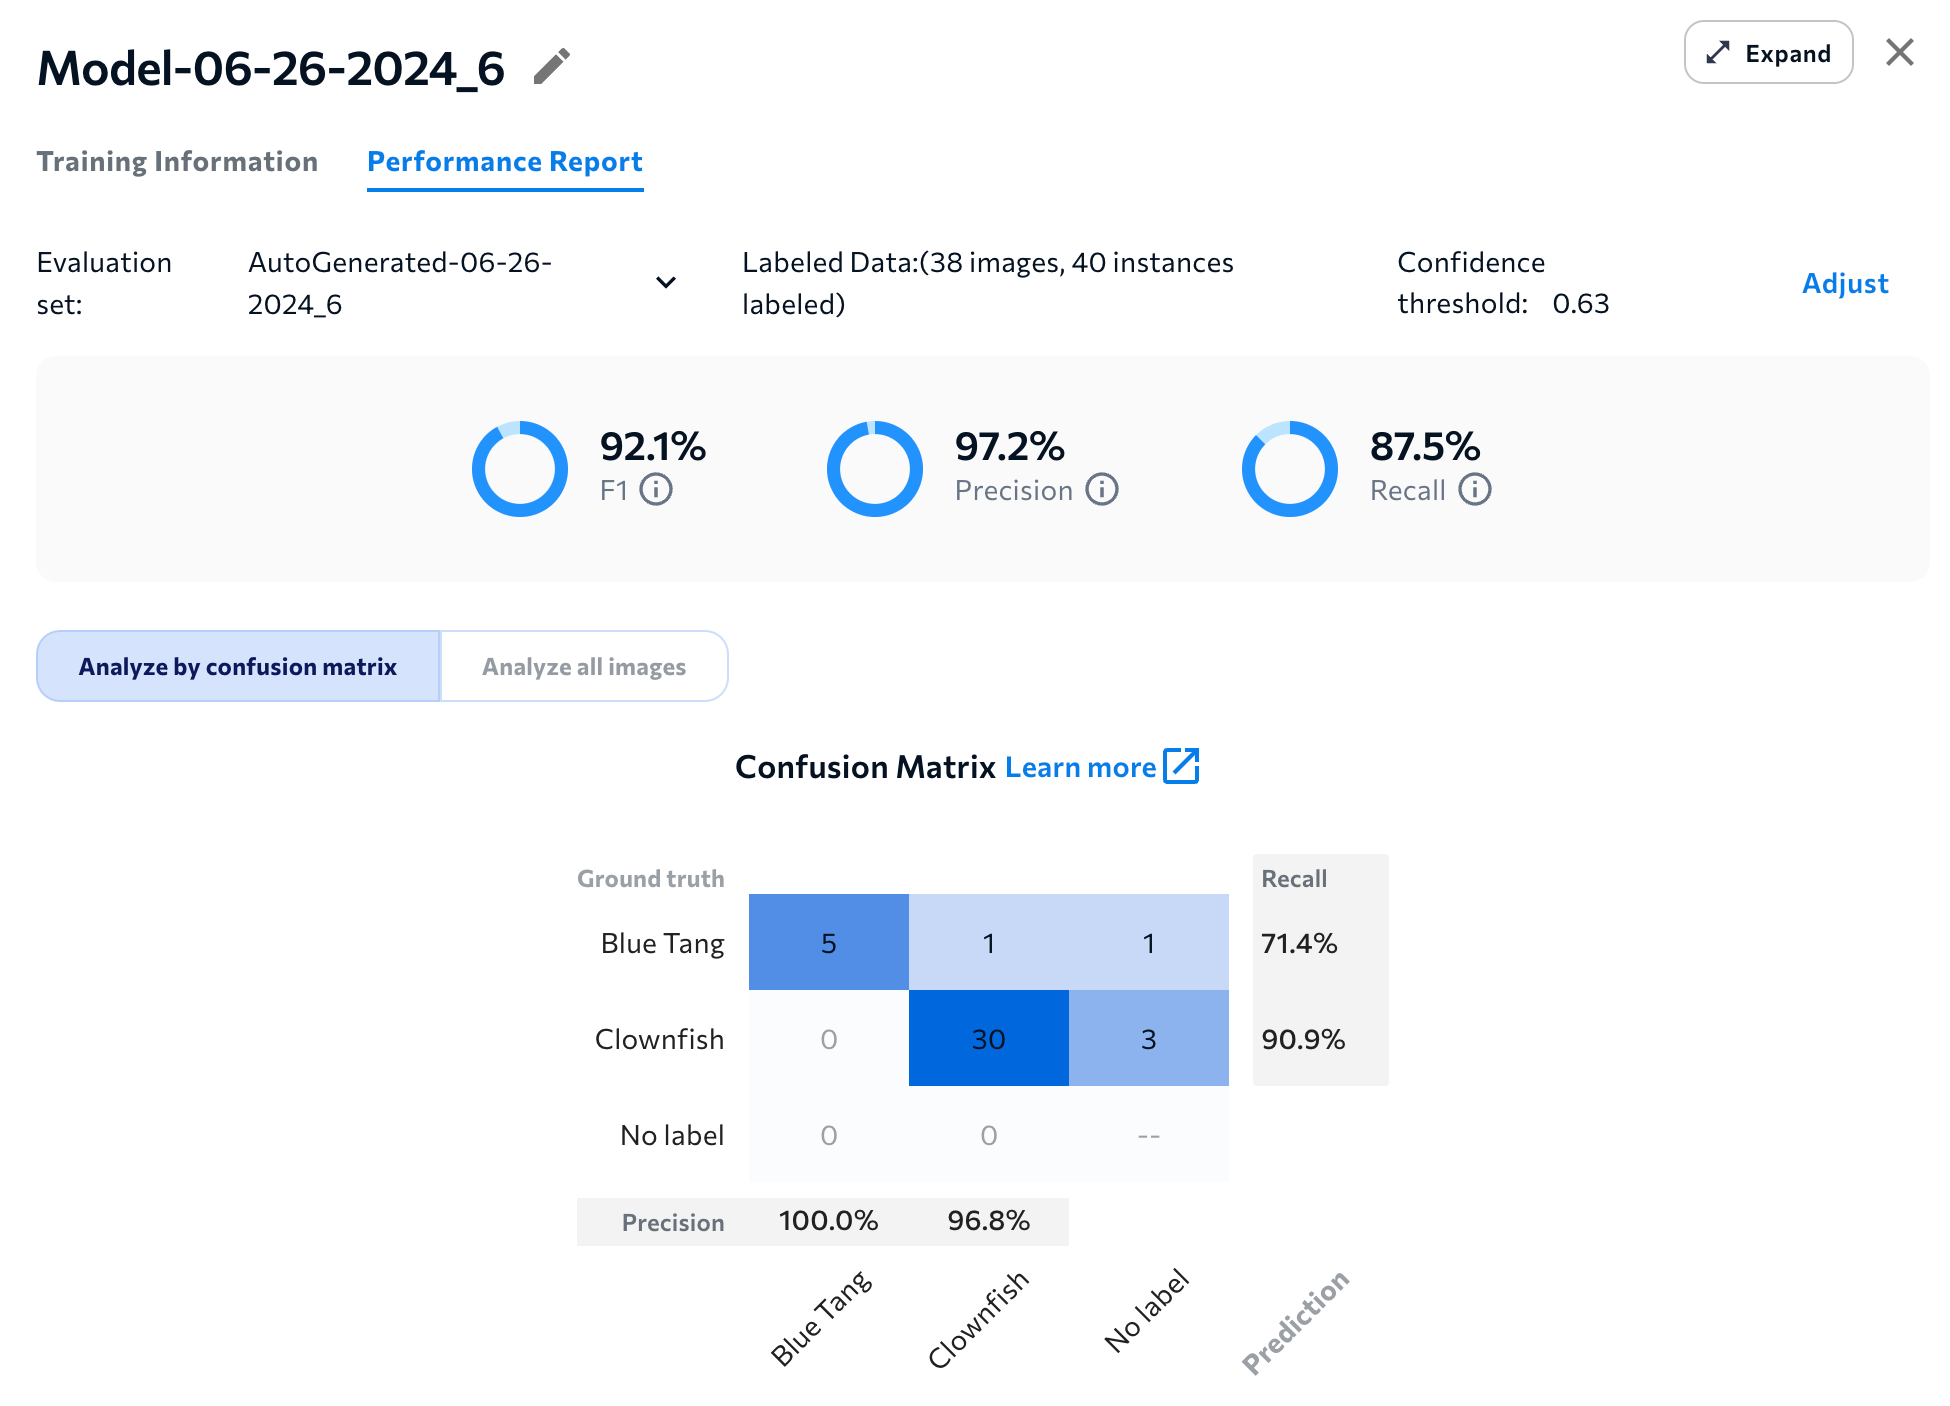
- LandingLens creates a new performance report for the selected threshold. (This is a temporary report. If you close and then later reopen the report, the data will be for the original threshold.)
Overall Score for the Evaluation Set
The Performance Report includes a score for the evaluation set (and not for the entire dataset). The type of score depends on the project type:- Object Detection, Classification, Anomaly Detection: F1 Score
- Segmentation: Intersection Over Union (IoU)
Object Detection, Classification, Anomaly Detection: F1 Score
The Performance Report includes the F1 score for Object Detection, Classification, and Anomaly Detection projects.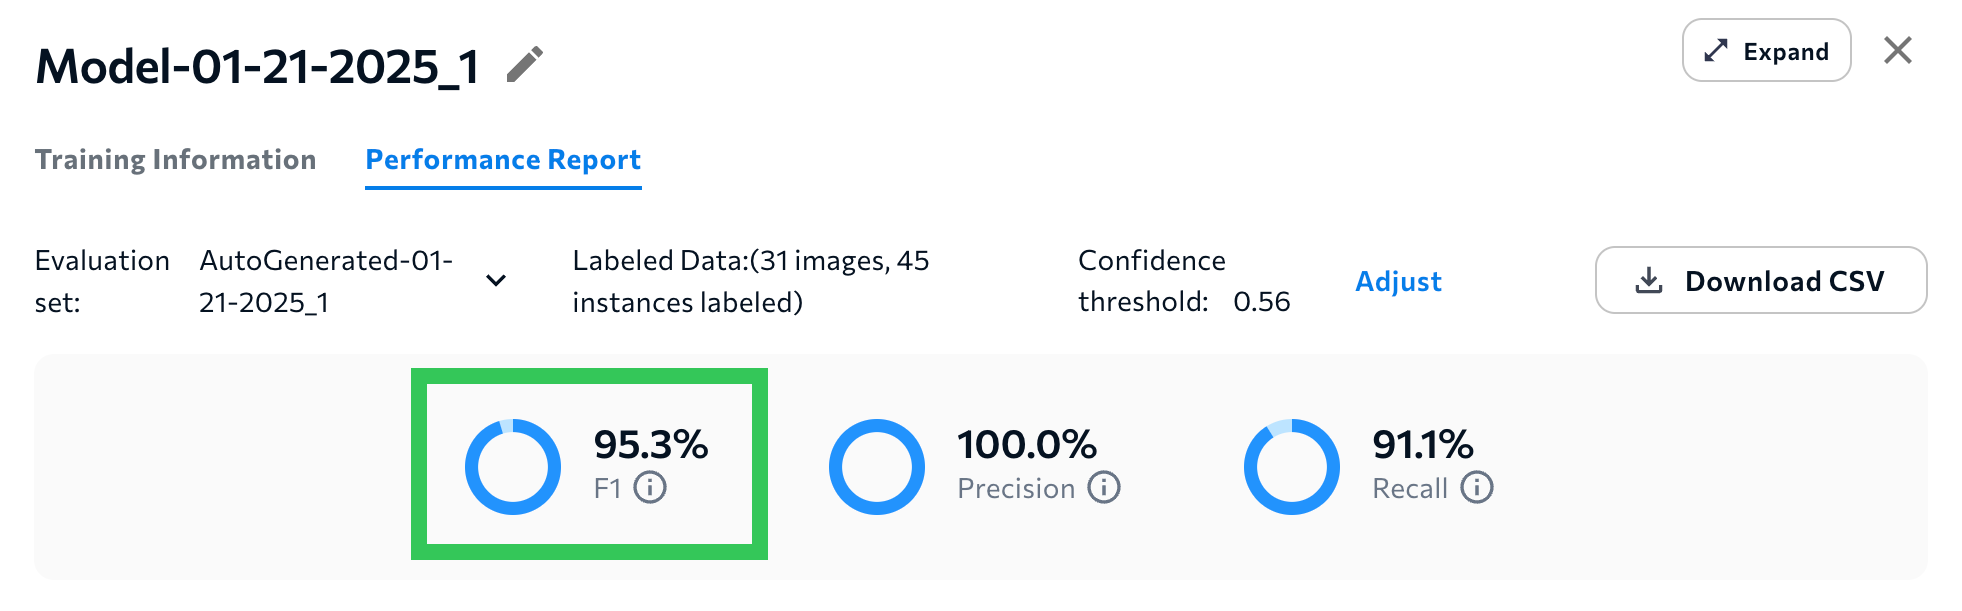
Segmentation: Intersection Over Union (IoU)
The Performance Report includes the Intersection over Union (IoU) score for Segmentation projects.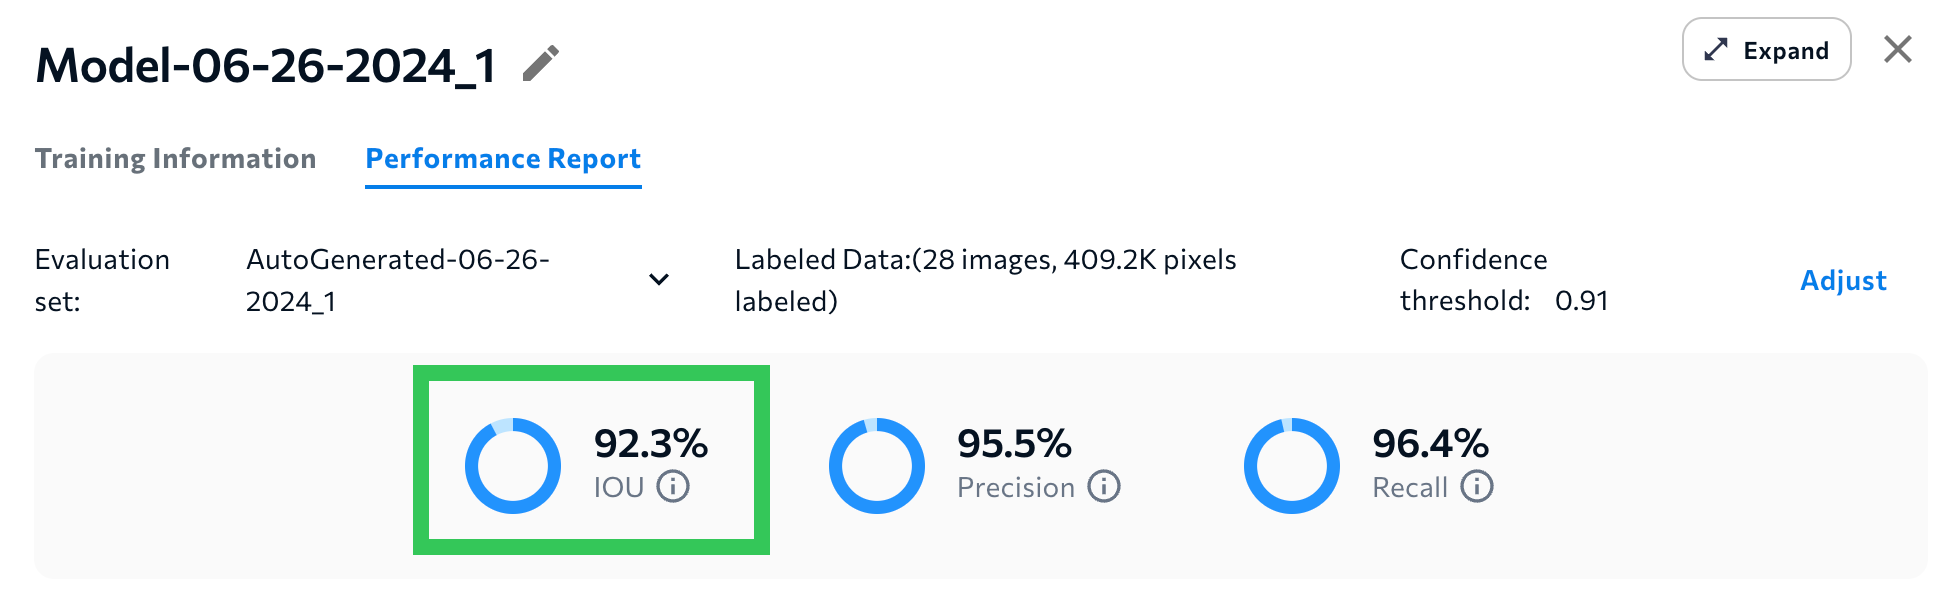
Precision Score for Evaluation Set
The Performance Report includes the Precision score for the evaluation set (and not for the entire dataset).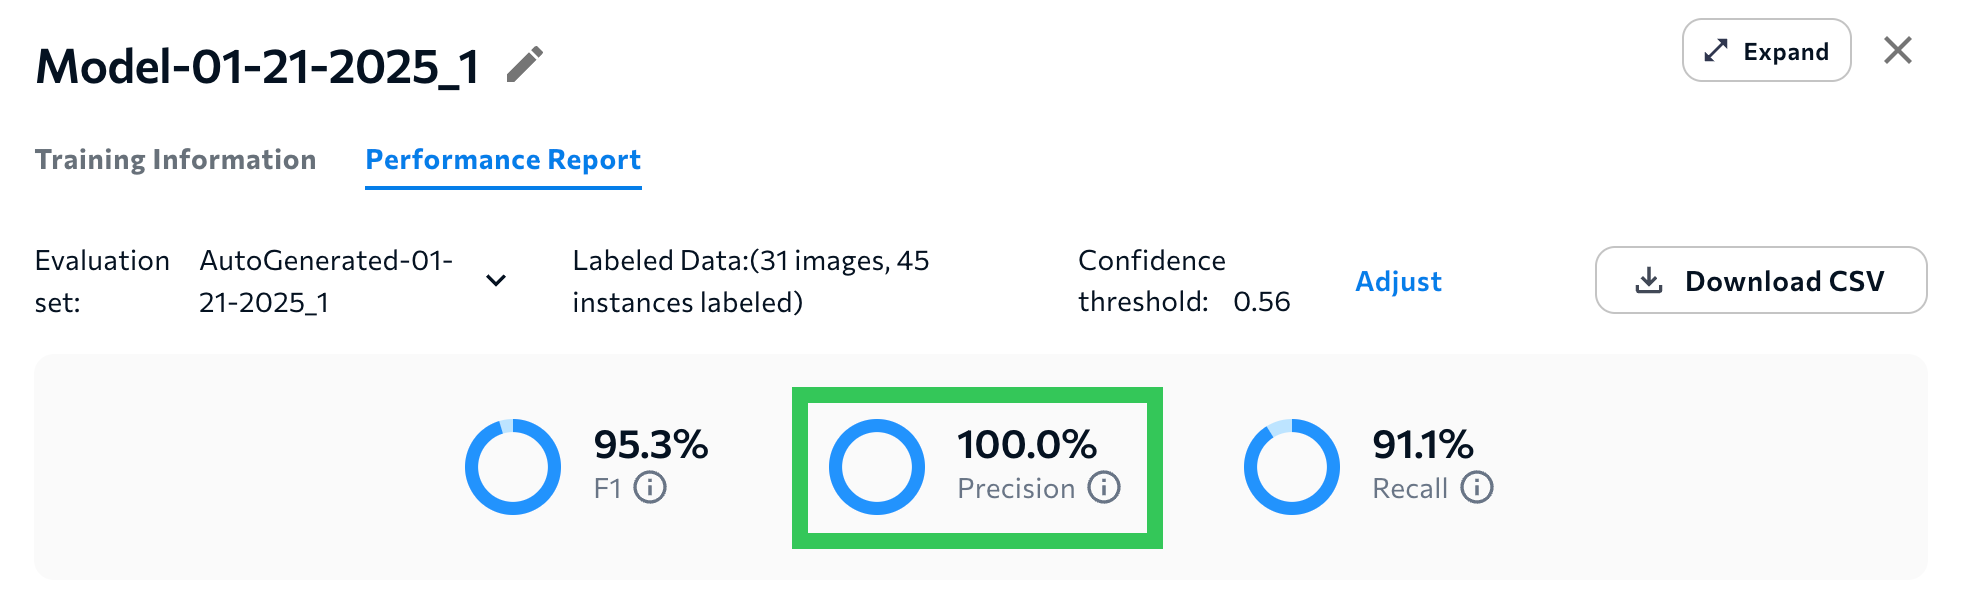
Recall Score for Evaluation Set
The Performance Report includes the Recall score for the evaluation set (and not for the entire dataset).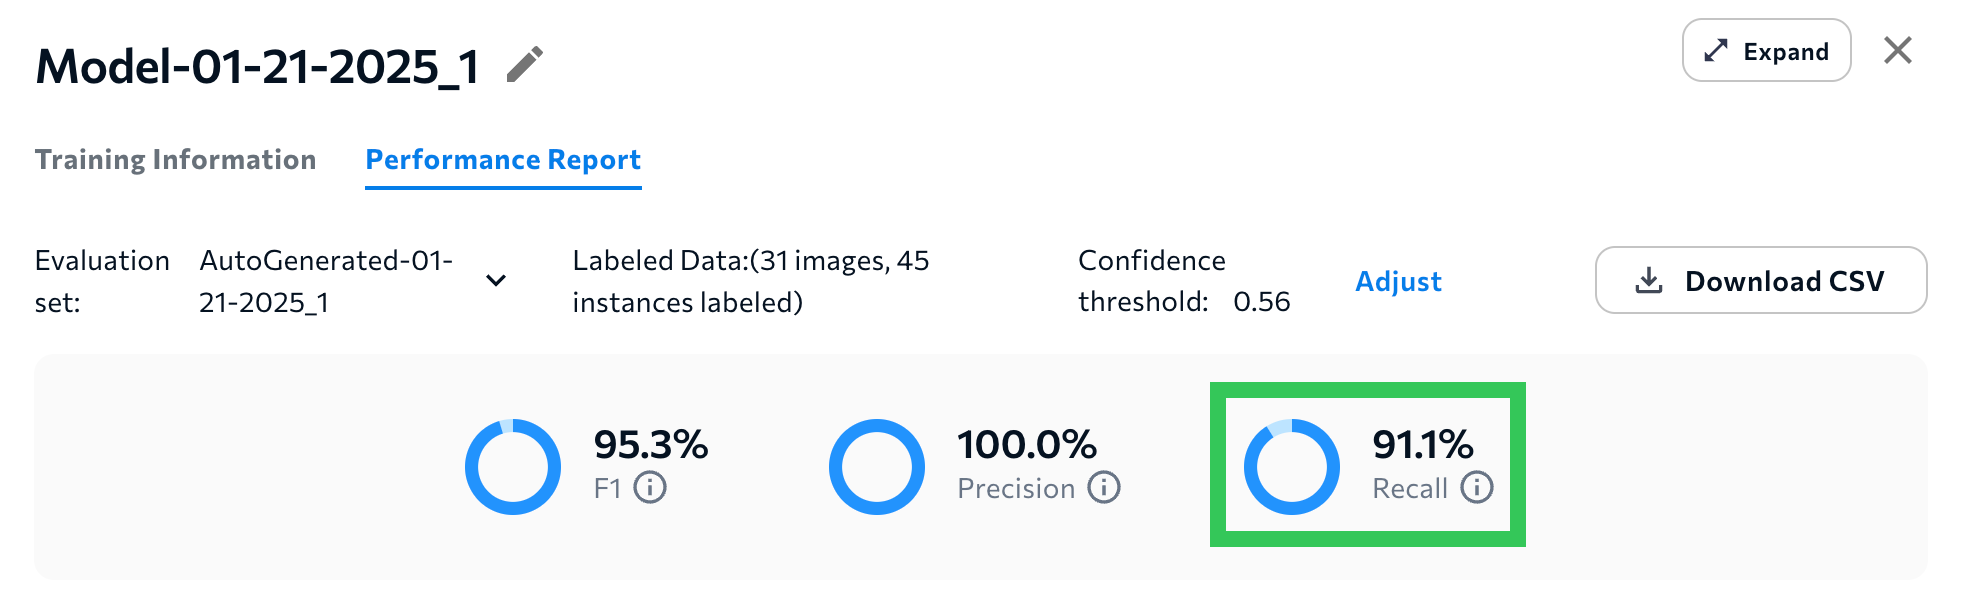
Download CSV of Evaluation Set
For Object Detection and Classification projects, click Download CSV to download a CSV of information about the images in the evaluation set. The CSV includes several data points for each image, including the labels (“ground truth”) and model’s predictions.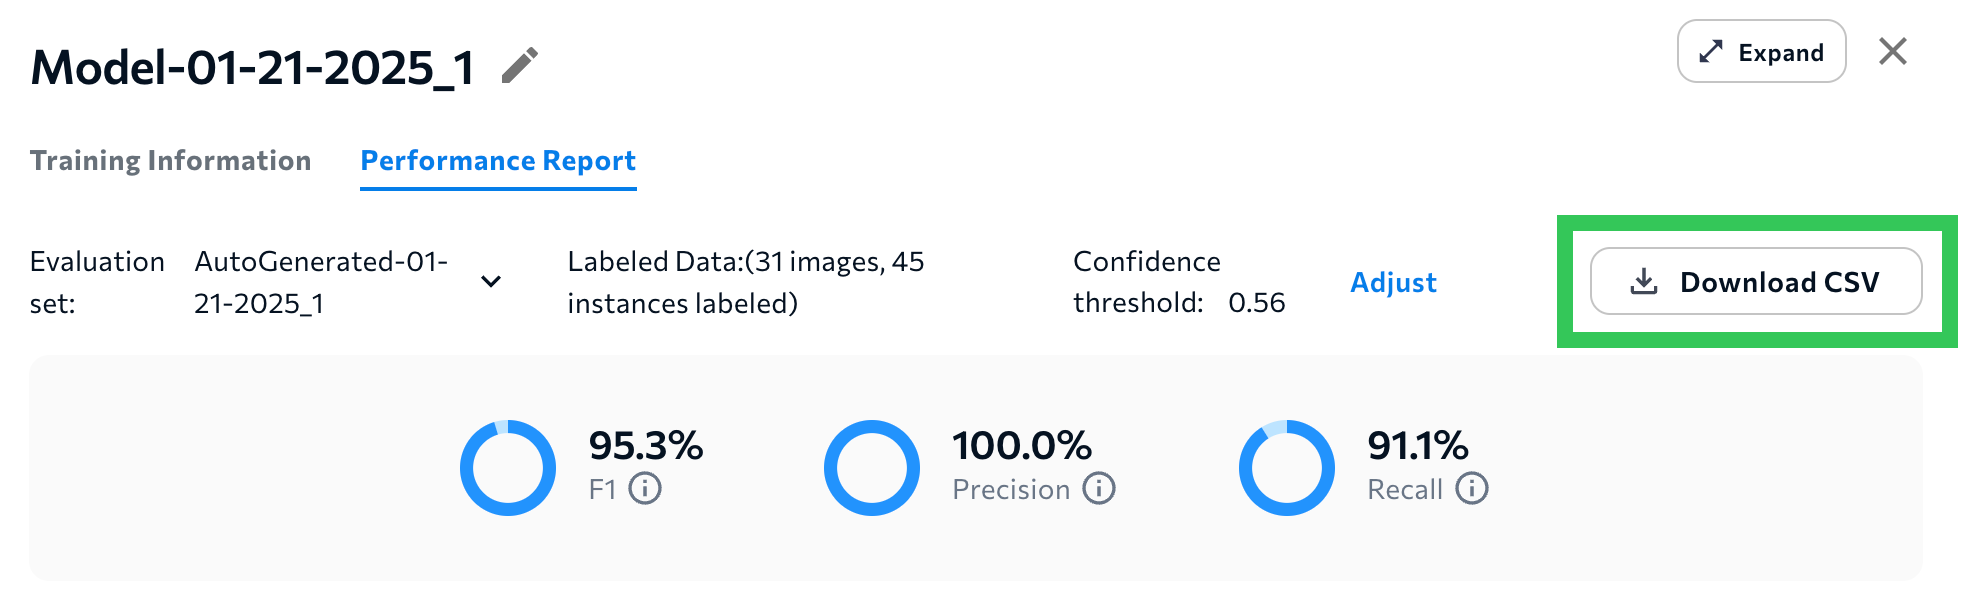
CSV Data for Evaluation Set
The CSV includes the information described in the following table.This CSV covers the selected evaluation set. If you want per-image predictions for every split in the model’s dataset, or you want to download the data with the API, go to Download CSV of Model Predictions.
Confusion Matrix
The Performance Report includes a Confusion Matrix that counts ground truth labels versus model predictions. The confusion matrix shown here is for the selected evaluation set. The y-axis represents each ground truth label. The x-axis represents each possible model prediction. Each cell shows the count of instances that correspond to particular ground truth class-predicted class pair. For example, in the image below, the model correctly predicted the class “Wheat” 6 times and misclassified it 2 times.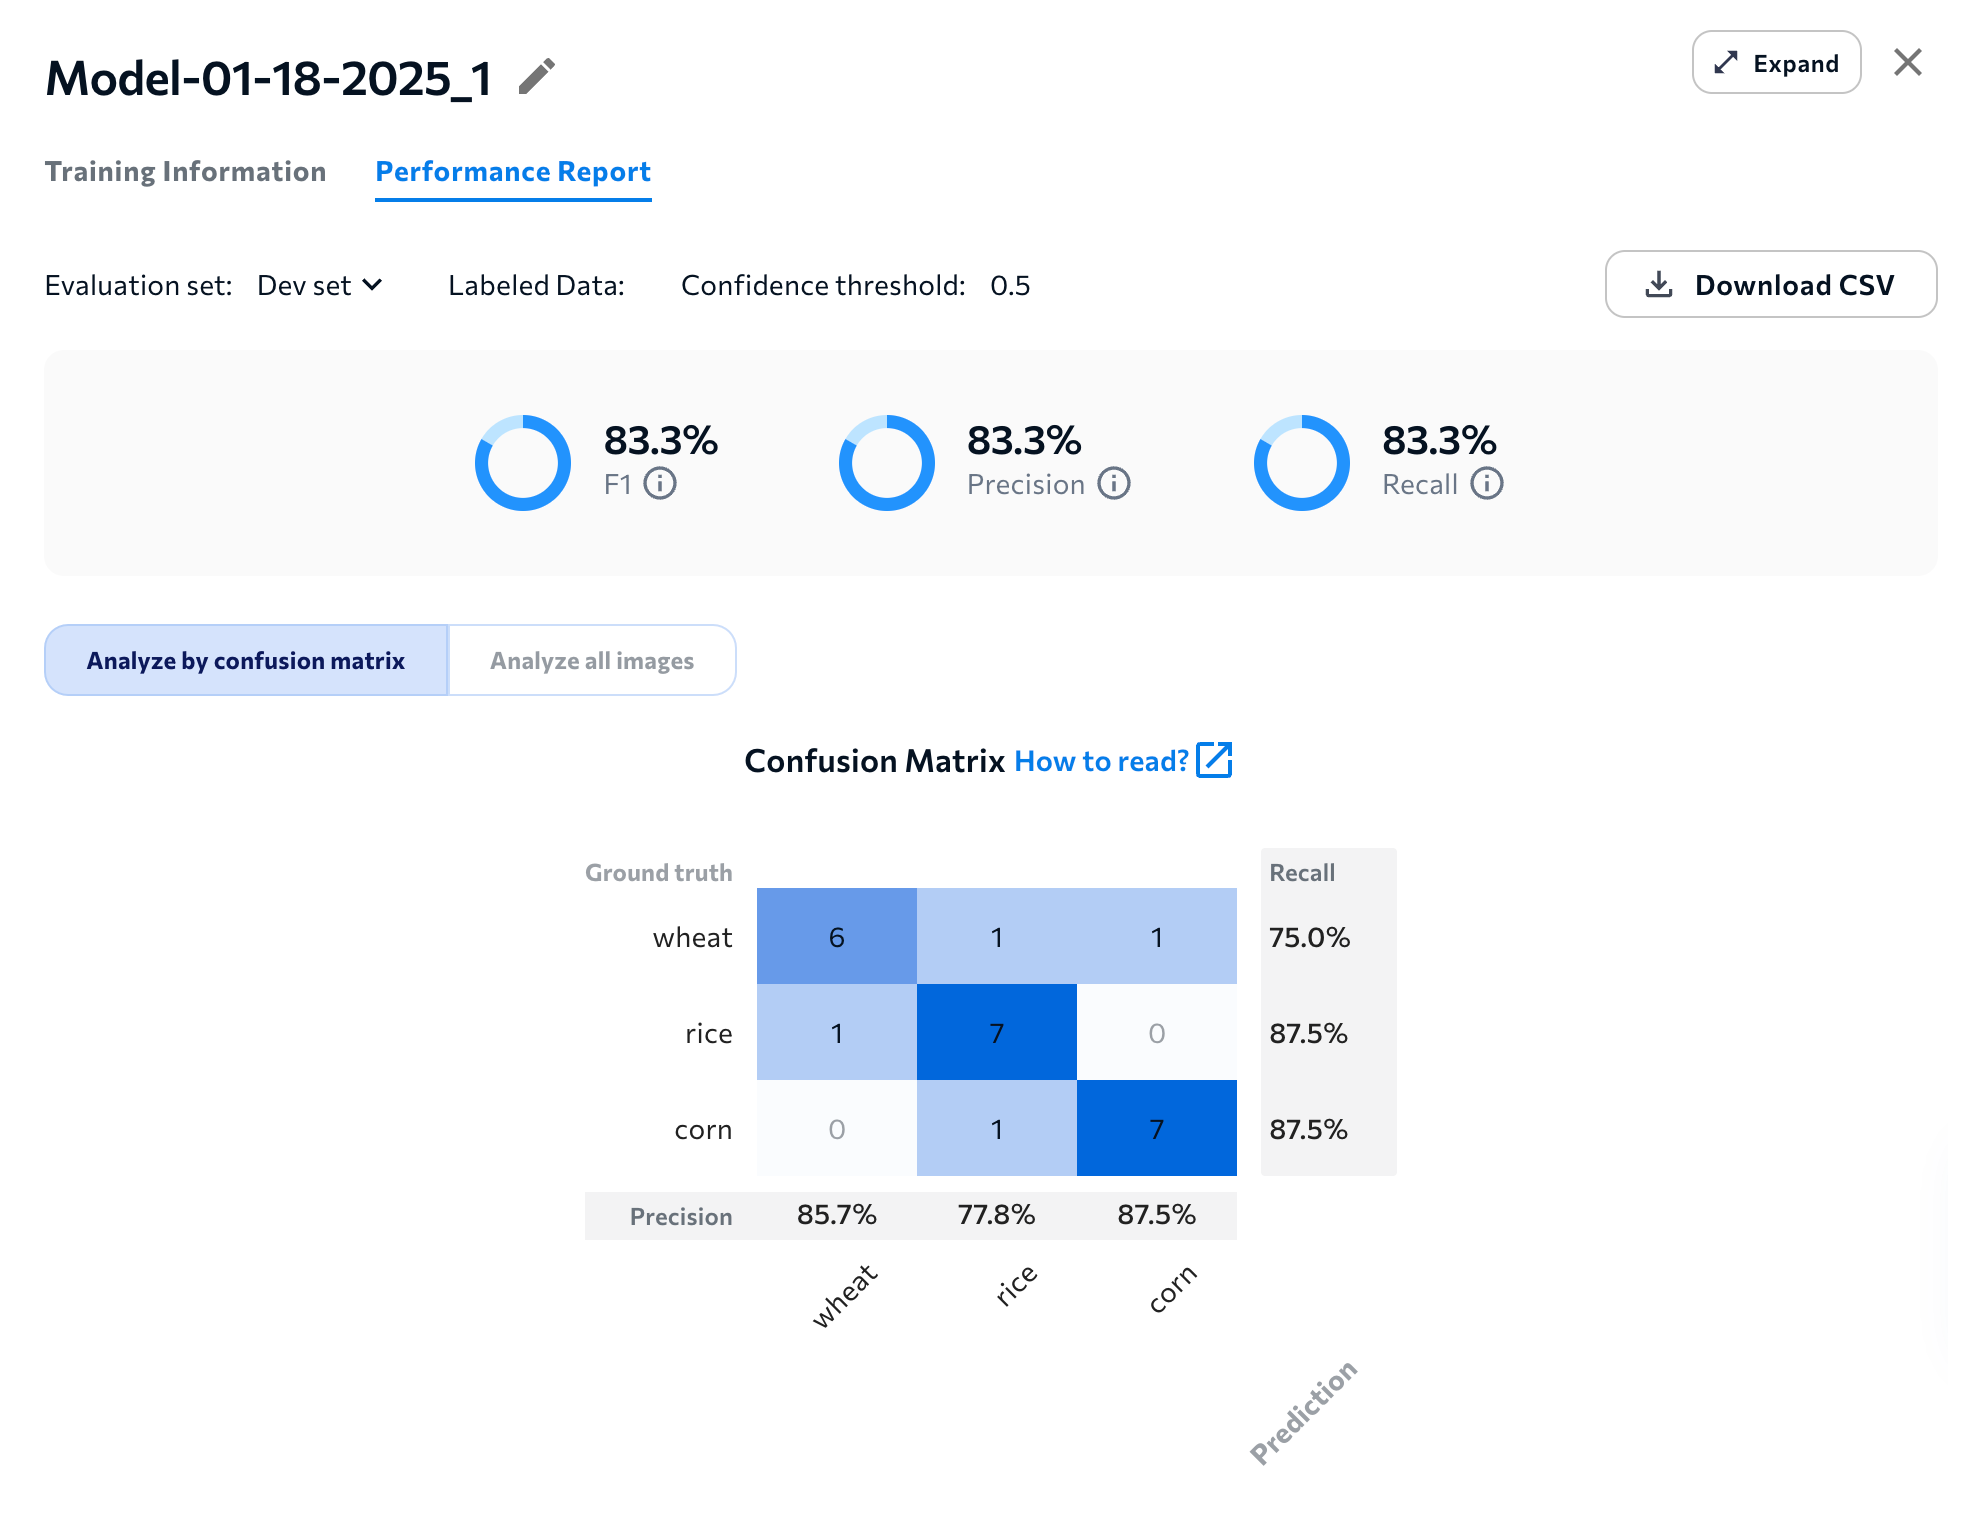
Precision Score for Class
The Precision score for each class is listed along the x-axis. Precision answers the natural language question, “When the model predicts Class A, how often is it correct?” The Precision score for a class is the percentage of instances that the model correctly predicted the class out of all instances that the model predicted the class, and is calculated using this equation: For example, let’s calculate the Precision score for the Wheat class in the image below. The model predicts Wheat 7 times. Of those, 6 are correct (True Positives) and 1 is incorrect (False Positives). When we plug those numbers into the Precision equation, we see that the Precision for this class is 85.7%.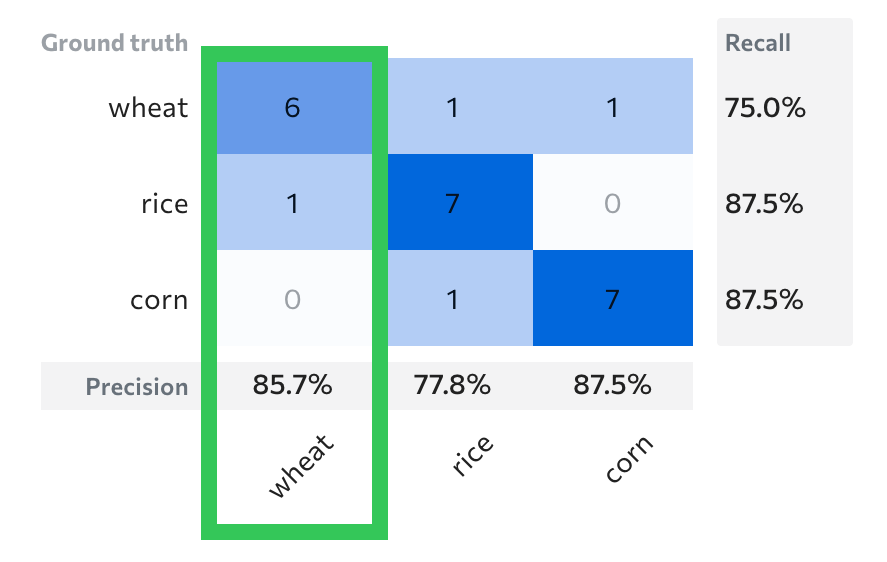
Recall Score for Class
The Recall score for each class is listed along the y-axis. Recall answers the natural language question, “Of all the Class As in the dataset, what percent of them are found by the model?” The Recall score for a class is the percentage of instances that the model correctly predicted the class out of all actual instances of the class, and is calculated using this equation: For example, let’s calculate the Recall score for the Wheat class in the image below. The dataset has 8 instances of Wheat. The model predicts 6 instances correctly (True Positives) and 2 instances incorrectly (False Negatives). When we plug those numbers into the Recall equation, we see that the Recall for this class is 75.0%.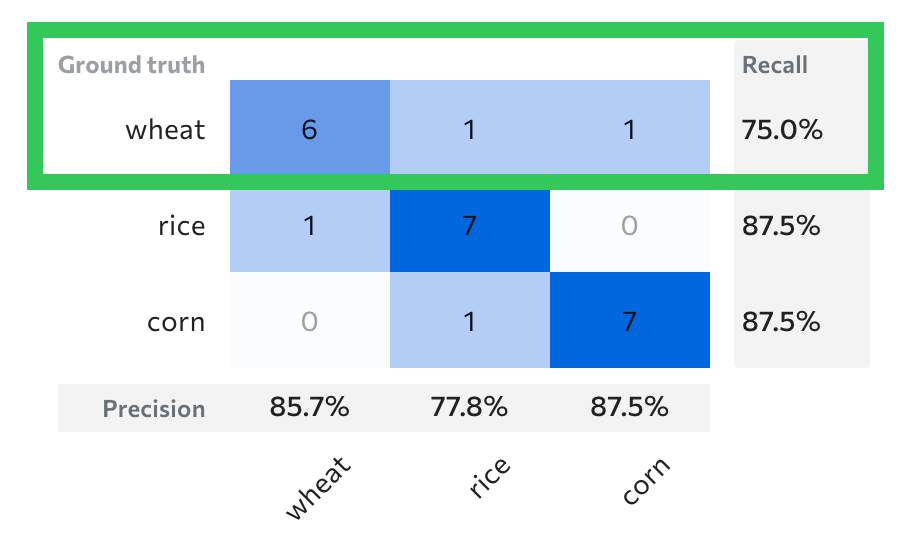
Use Colors to Help Interpret Performance
Each cell has a color that can quickly help you identify correct classifications and errors. Darker colors indicate a higher number, and lighter colors indicate a lower number. For example, if the model correctly predicts all instances, only the cells on the diagonal will be blue and have non-zero values. See the following image as an example.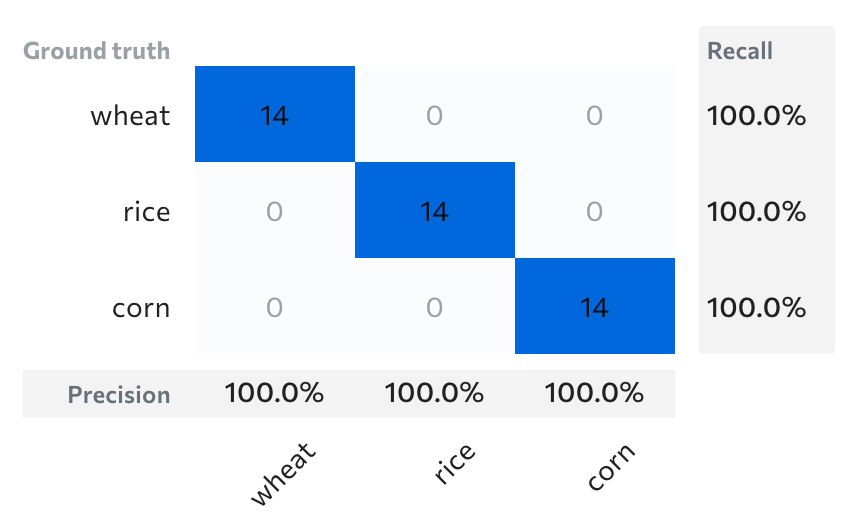
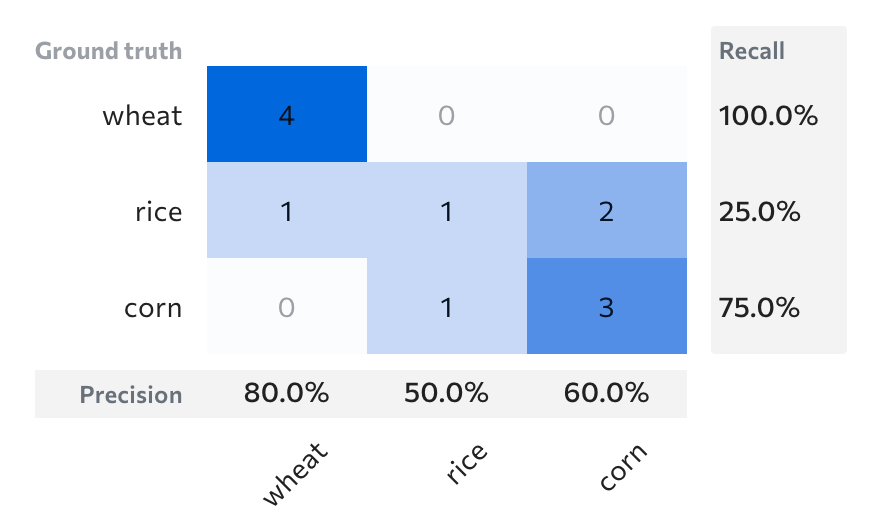
Click a Cell for Detailed Information
Click a cell in the confusion matrix to see detailed information for that ground truth / prediction pairing. For example, click the Wheat/Corn cell in the image below to see the image that was labeled as Wheat but predicted as Corn. The table on the left shows the ground truth / prediction pairings for all images in the evaluation set. The section on the right shows the images that represent the cell you clicked.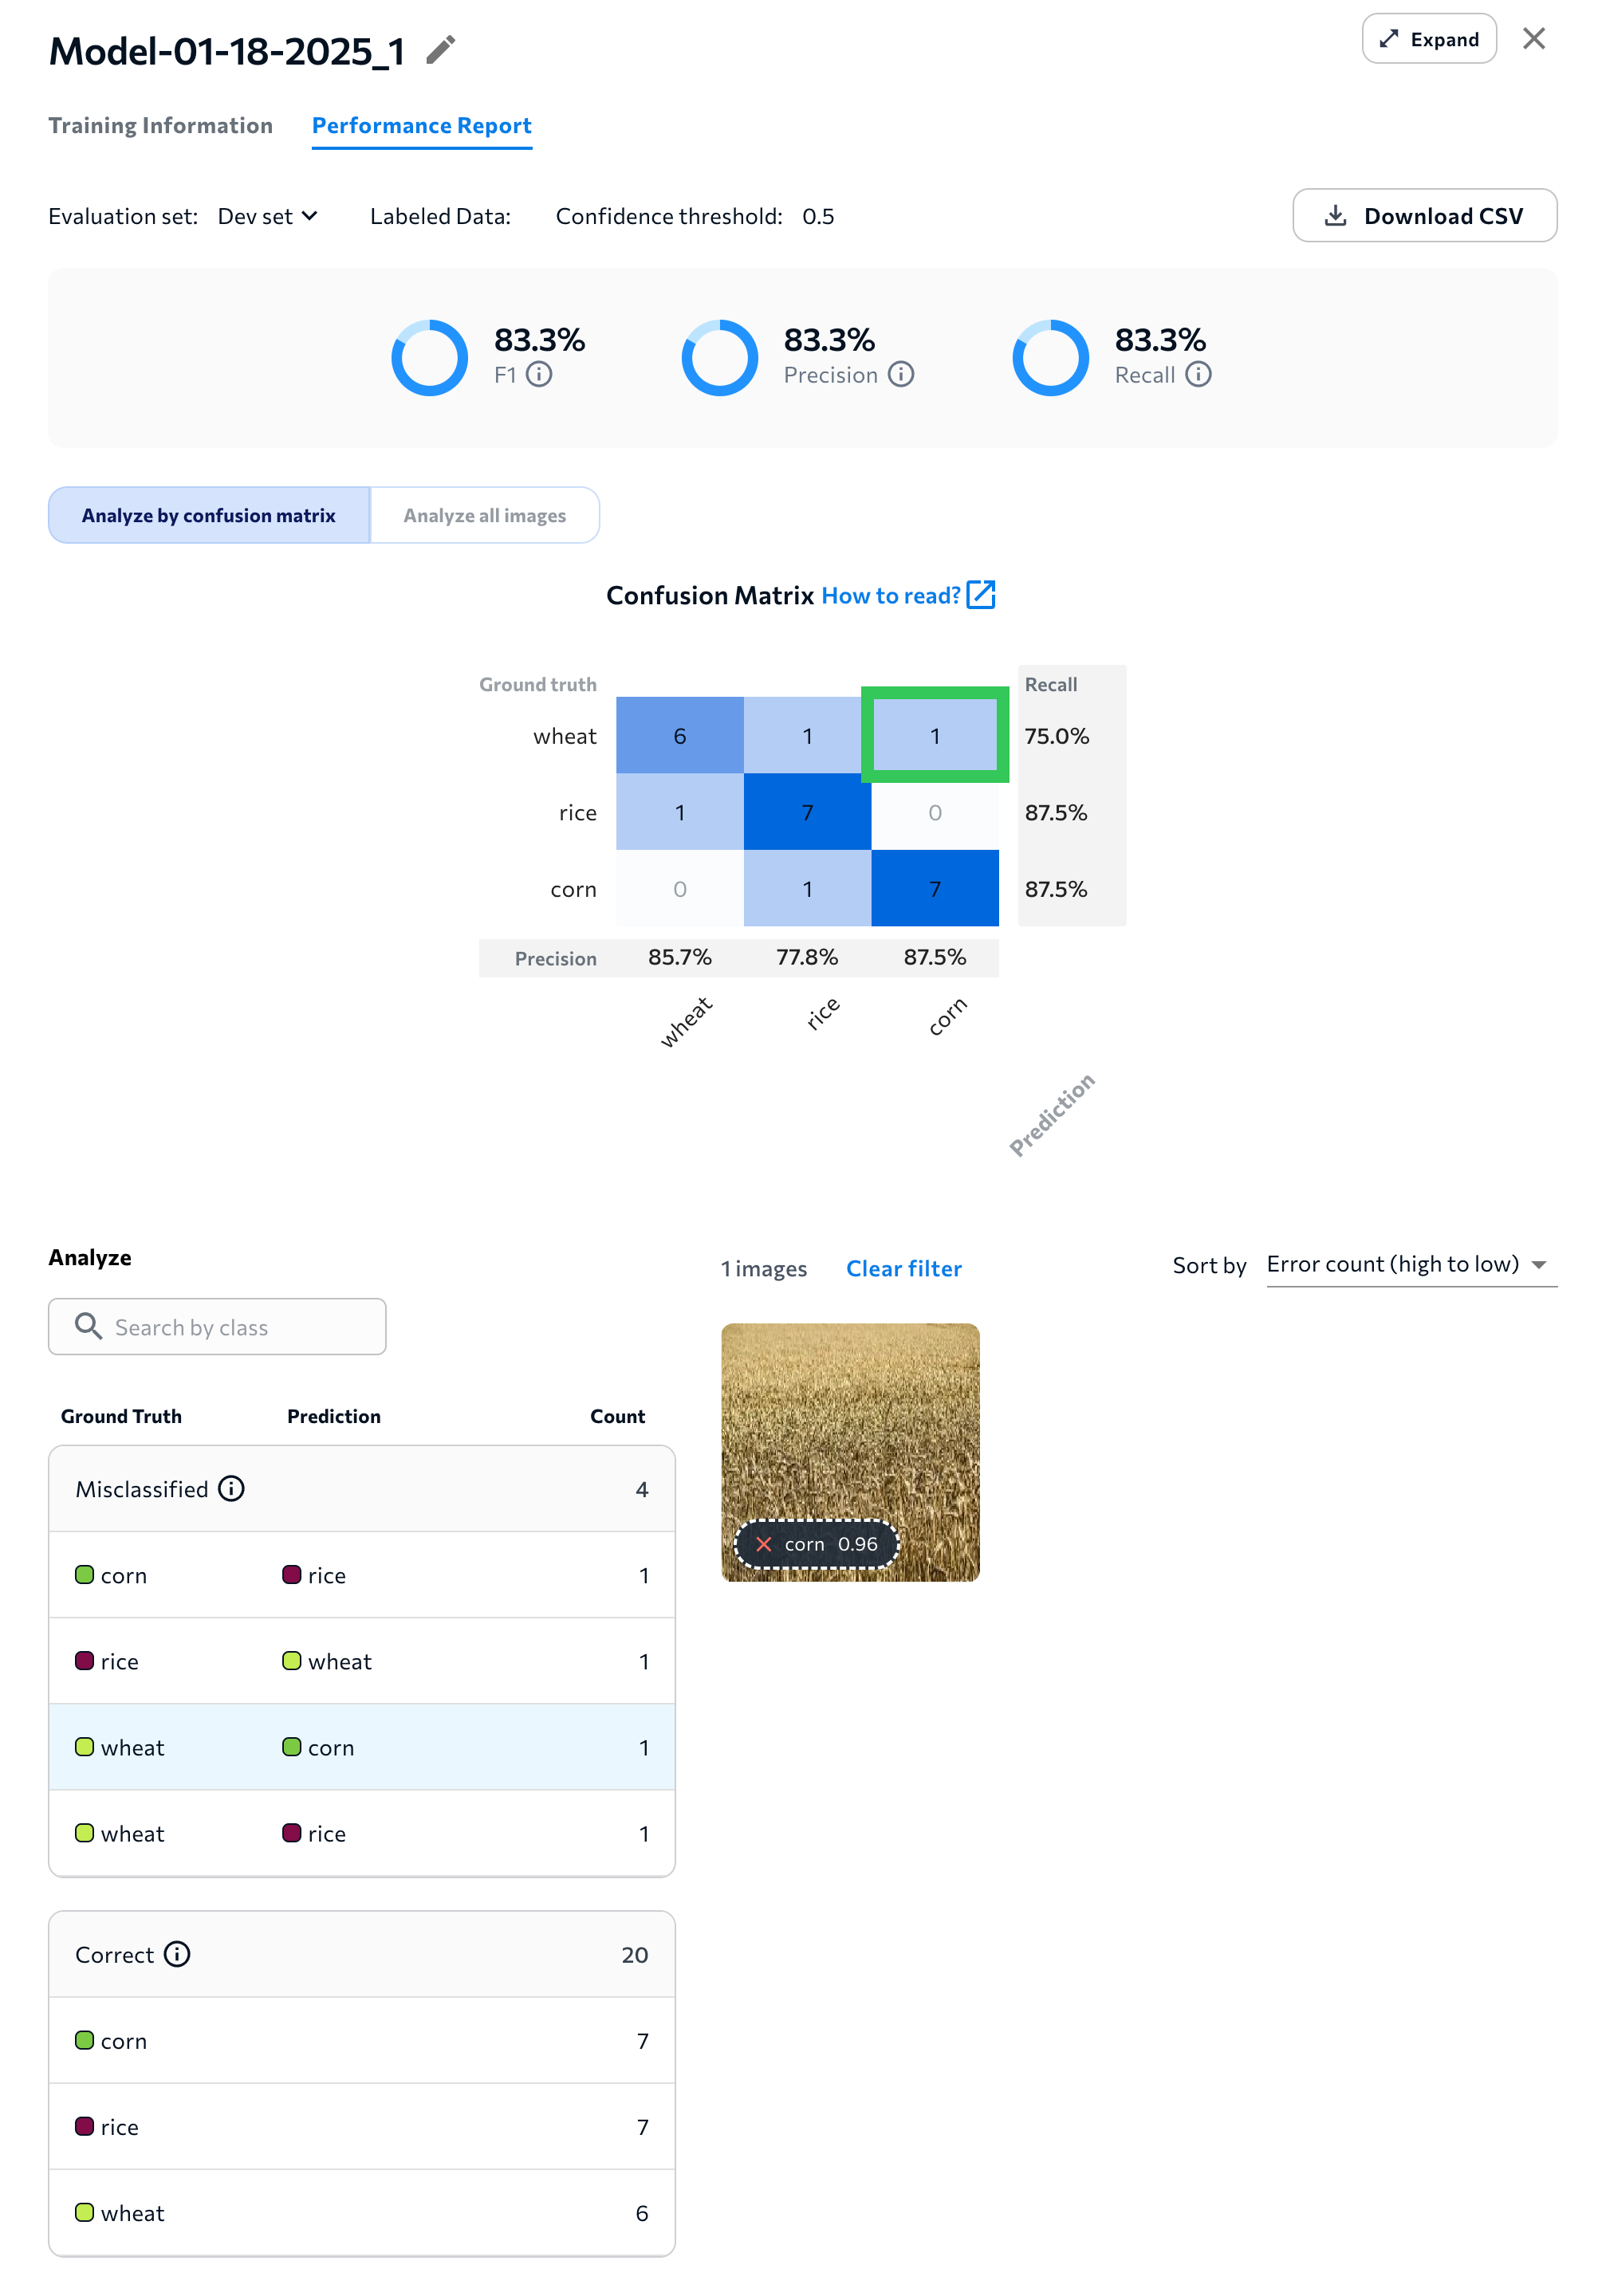
Analyze All Images
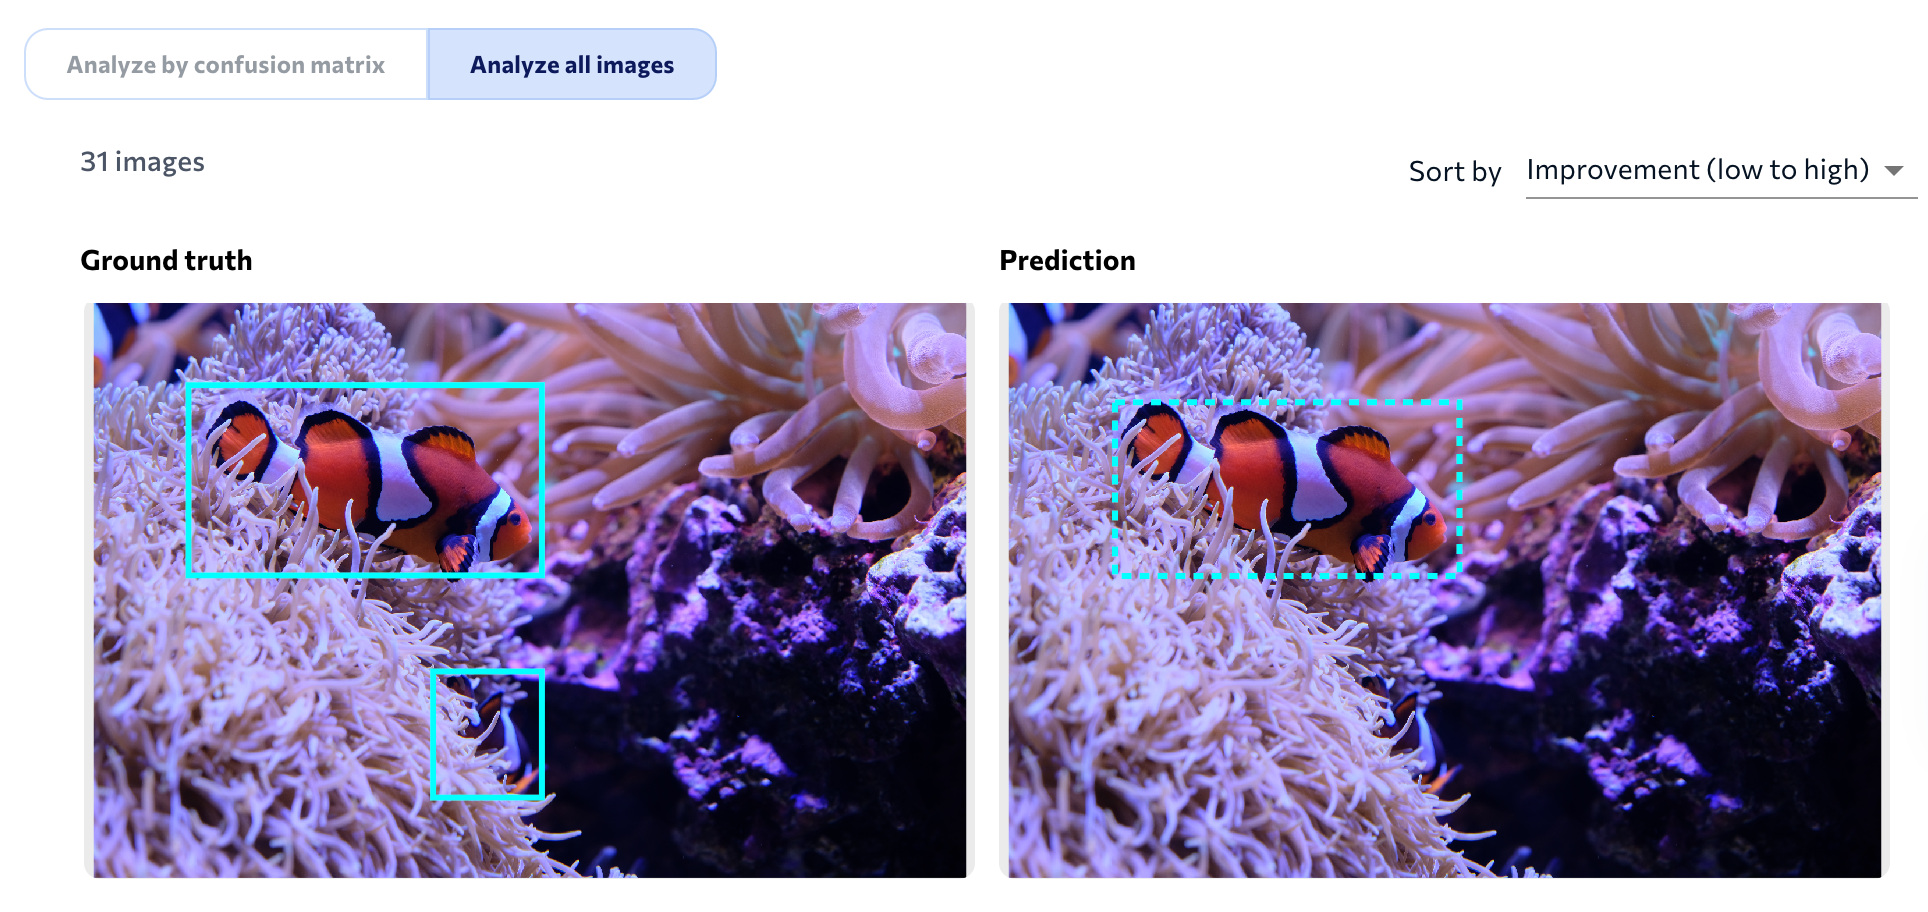
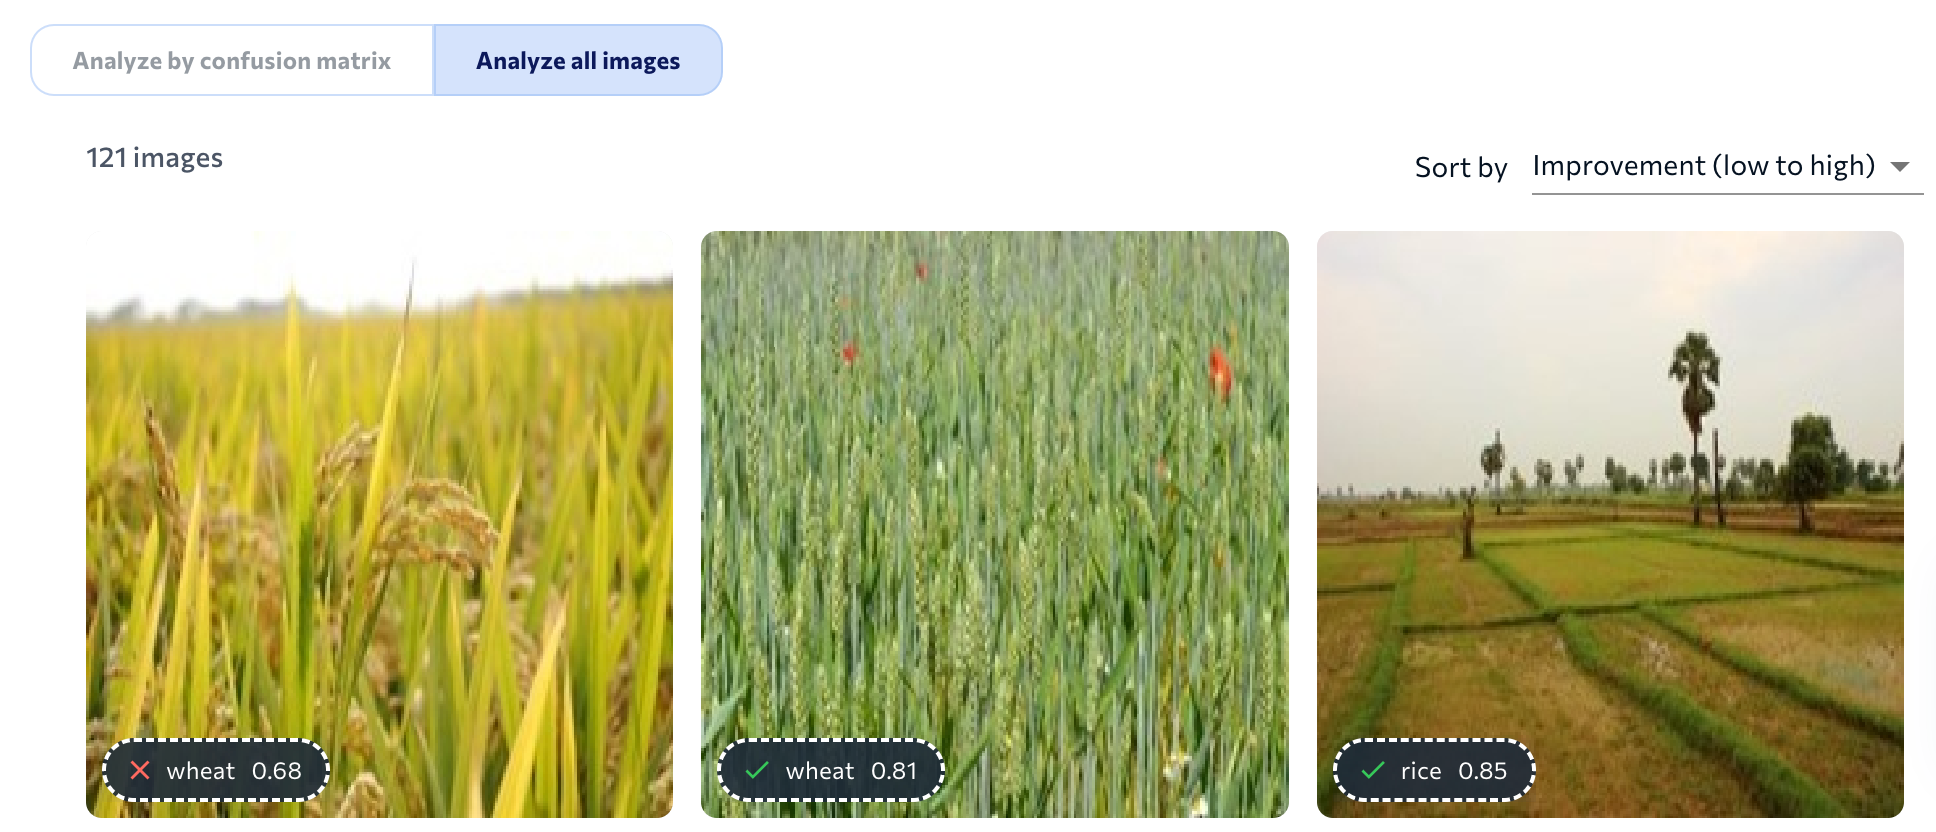
Click Analyze All Images to see all images with their ground truth labels and predictions. Click an image to see a larger version. For Object Detection and Segmentation, LandingLens shows a side-by-side comparison of the ground truth labels and predictions on each image in the dataset.