> ## Documentation Index
> Fetch the complete documentation index at: https://landinglens.docs.landing.ai/llms.txt
> Use this file to discover all available pages before exploring further.
# Training Information
export const vp = 'Visual Prompting';
export const smartLabel = 'Smart Labeling';
export const productLL = 'LandingLens';
export const mi = 'Mobile Inference';
export const llsf = 'LandingLens on Snowflake';
export const companyName = 'LandingAI';
*This article applies to these versions of LandingLens:*
| LandingLens |
LandingLens on Snowflake |
| ✓ |
✓ |
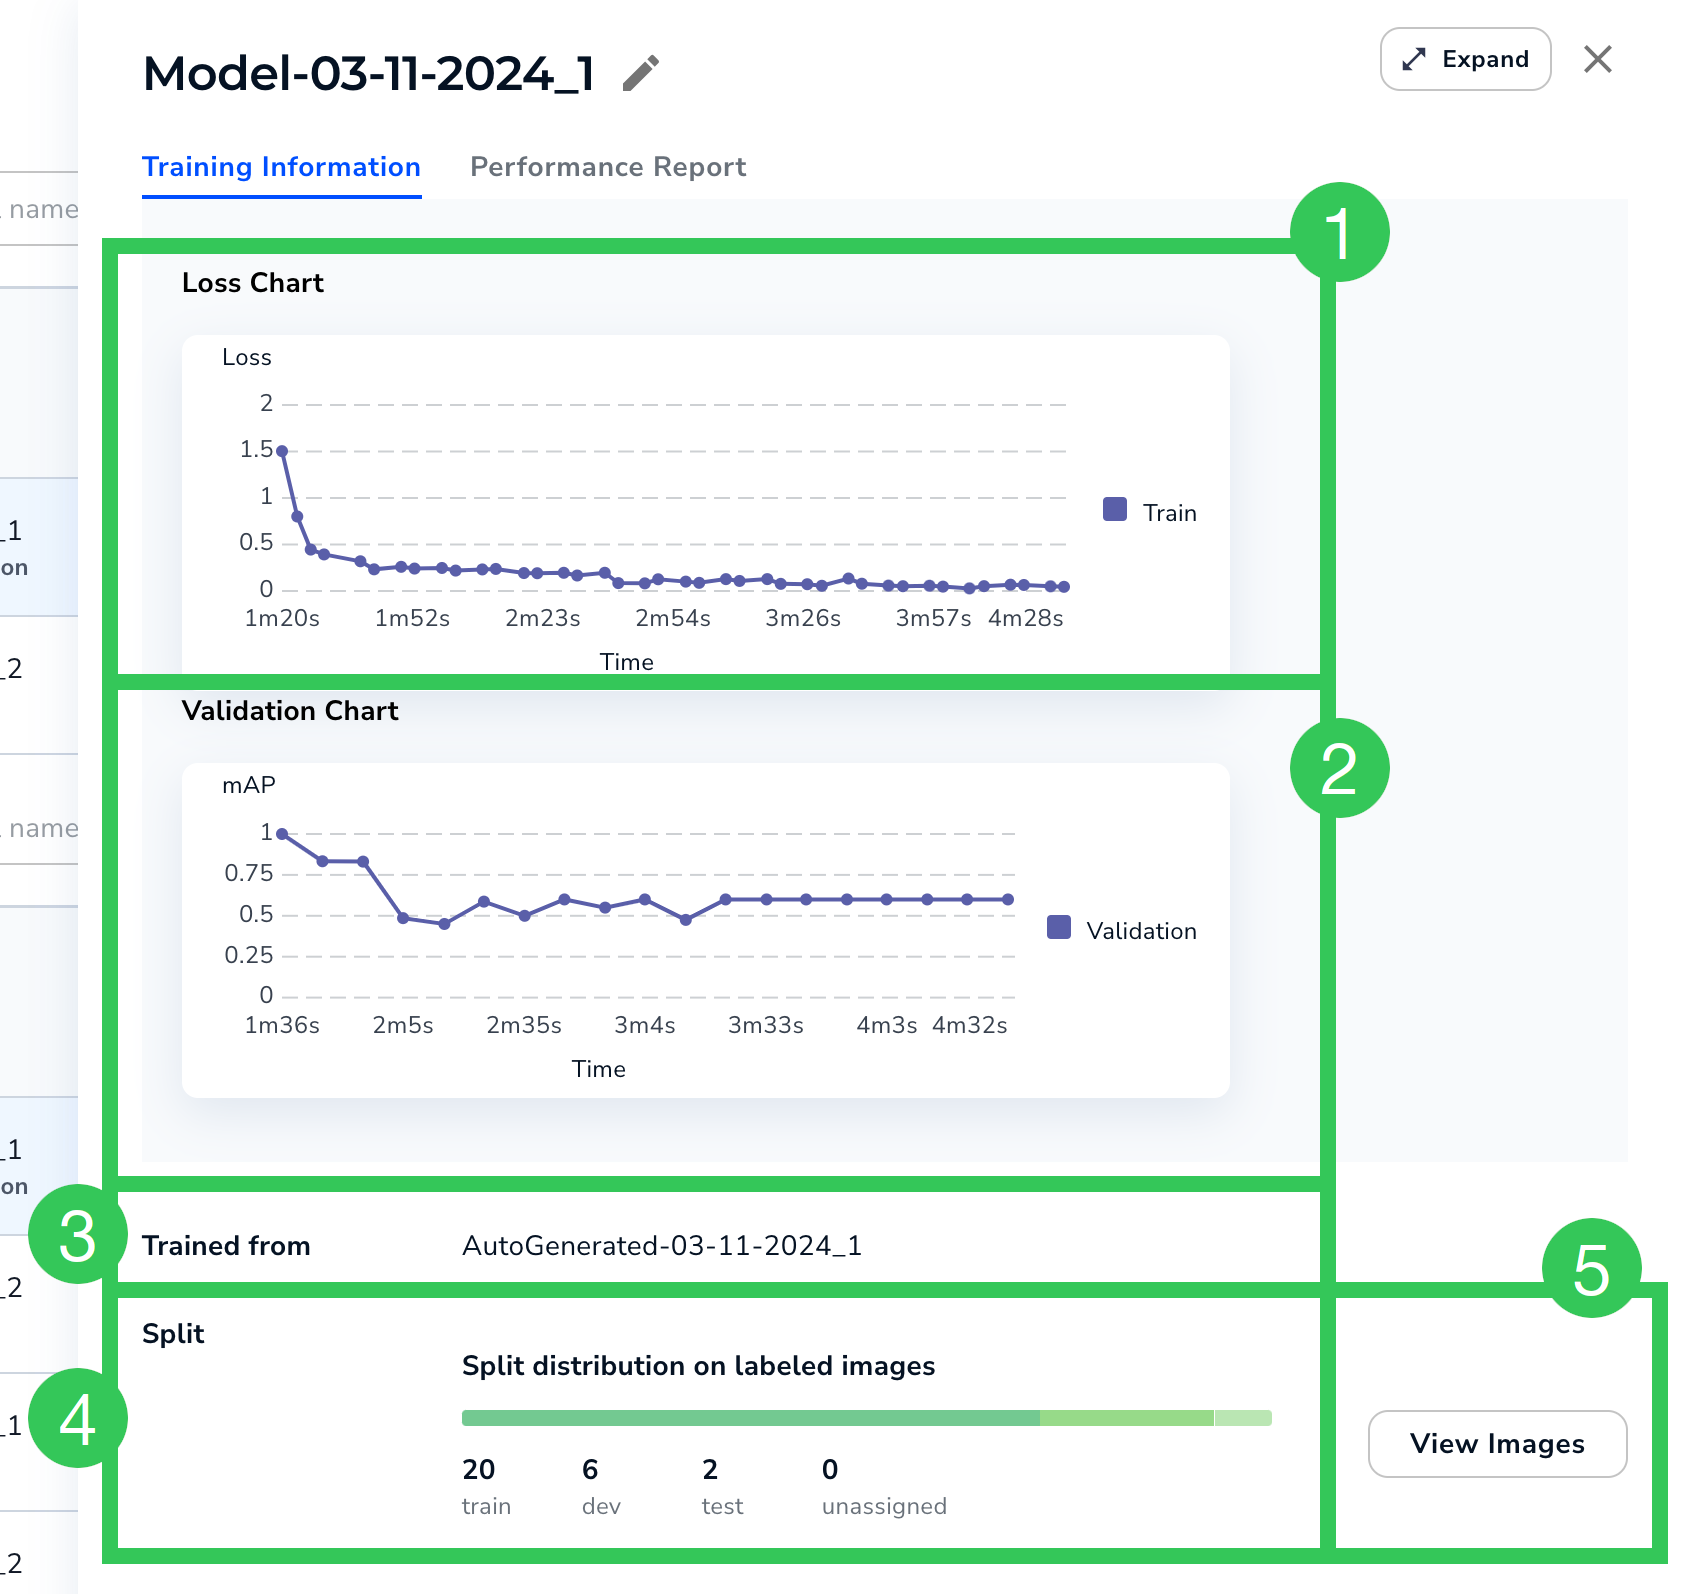
Clicking a model on the **Models** page opens the **Training Information** tab. This tab shows basic information about the model and the dataset it was trained on.
Highlights include:
 | # | Item | Description |
| - | ----------------------------------------------- | --------------------------------------------------------------------------------------------------------------------------------------------------------------------------------------------------------------------------------------------------------------------------------------------------------------------------------------------------------------------------------------------------------------------------------------------------------------------------------------------------------------------------------------------------------------------------------------------- |
| 1 | Loss Chart | See [Loss Chart](#loss-chart) |
| 2 | Validation Chart | The Validation chart is calculated on the Dev split. This chart displays when the model was trained using [Custom Training](./custom-training) and the Dev split has at least 6 images.
| # | Item | Description |
| - | ----------------------------------------------- | --------------------------------------------------------------------------------------------------------------------------------------------------------------------------------------------------------------------------------------------------------------------------------------------------------------------------------------------------------------------------------------------------------------------------------------------------------------------------------------------------------------------------------------------------------------------------------------------- |
| 1 | Loss Chart | See [Loss Chart](#loss-chart) |
| 2 | Validation Chart | The Validation chart is calculated on the Dev split. This chart displays when the model was trained using [Custom Training](./custom-training) and the Dev split has at least 6 images.
If the model improves during the validation process, the line goes up over time. The line will look slightly different for each project type because each uses a different validation metric:- **Object Detection**: mAP (Mean Average Precision)
- **Segmentation**: mIoU (mean Intersection over Union)
- **Classification and Anomaly Detection**: F1 score
|
| 3 | Trained From | The name of the dataset [snapshot](./dataset-snapshots) that the model was trained on. |
| 4 | Split | Shows how many images are in each split. |
| 5 | View Images | Click **View Images** to see the dataset [snapshot](./dataset-snapshots) that the model was trained on. |
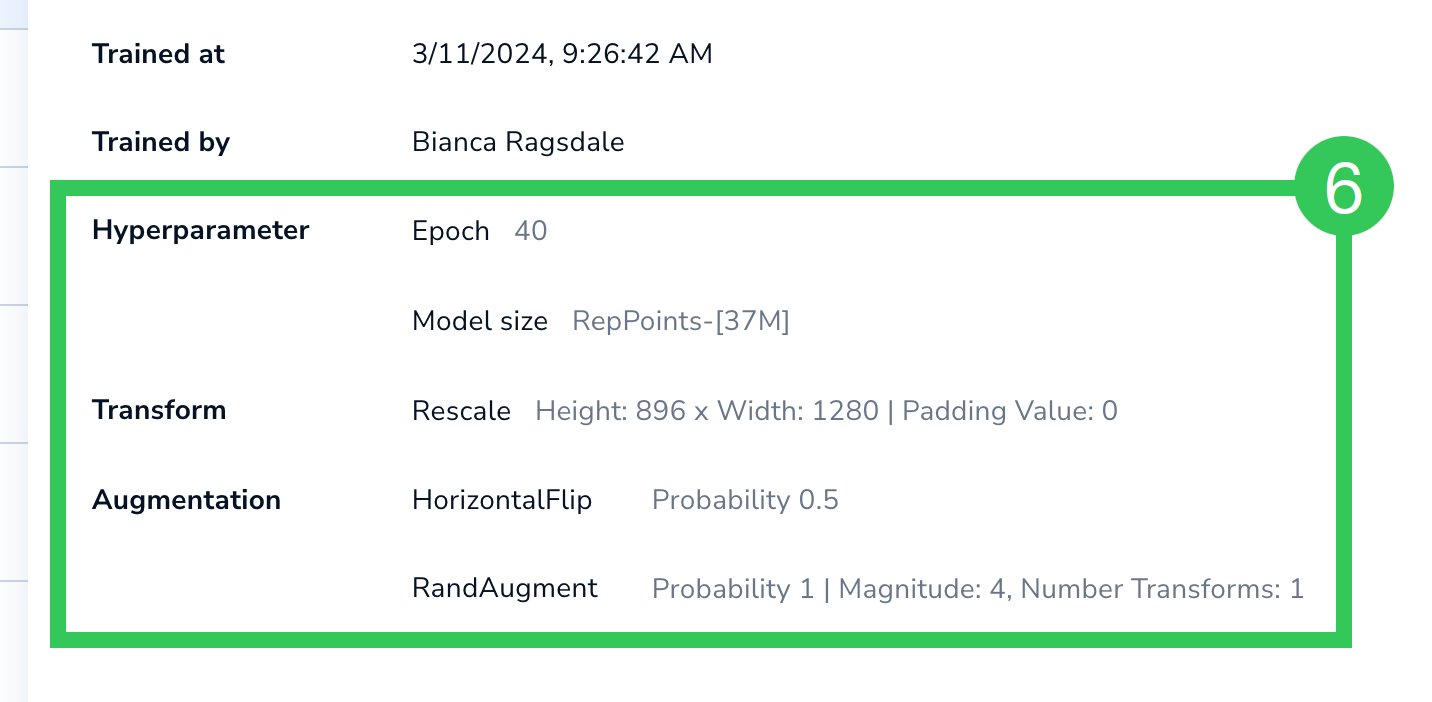
| 6 | Hyperparameter
Transform
Augmentation | The configurations used to train the model.
For Fast Training (default configuration), this includes **Hyperparameters**, which are the number of epochs and model size.
For Custom Training (customized configuration), this also includes any **Transforms** and **Augmentations**. For more information about these configurations, go to [Custom Training](./custom-training). |
## Loss Chart
The Loss chart is calculated on the Train split, which is the split that the model trains on.
During model training, LandingLens calculates the error between the ground truth and the predictions, which is called **loss**. This chart shows the loss over time (in seconds).
If the model improves during the training process, the line goes down toward 0 over time.