> ## Documentation Index
> Fetch the complete documentation index at: https://landinglens.docs.landing.ai/llms.txt
> Use this file to discover all available pages before exploring further.
# Model Reports
export const vp = 'Visual Prompting';
export const smartLabel = 'Smart Labeling';
export const productLL = 'LandingLens';
export const mi = 'Mobile Inference';
export const llsf = 'LandingLens on Snowflake';
export const companyName = 'LandingAI';
*This article applies to these versions of LandingLens:*
LandingLens
LandingLens on Snowflake
✓
✓
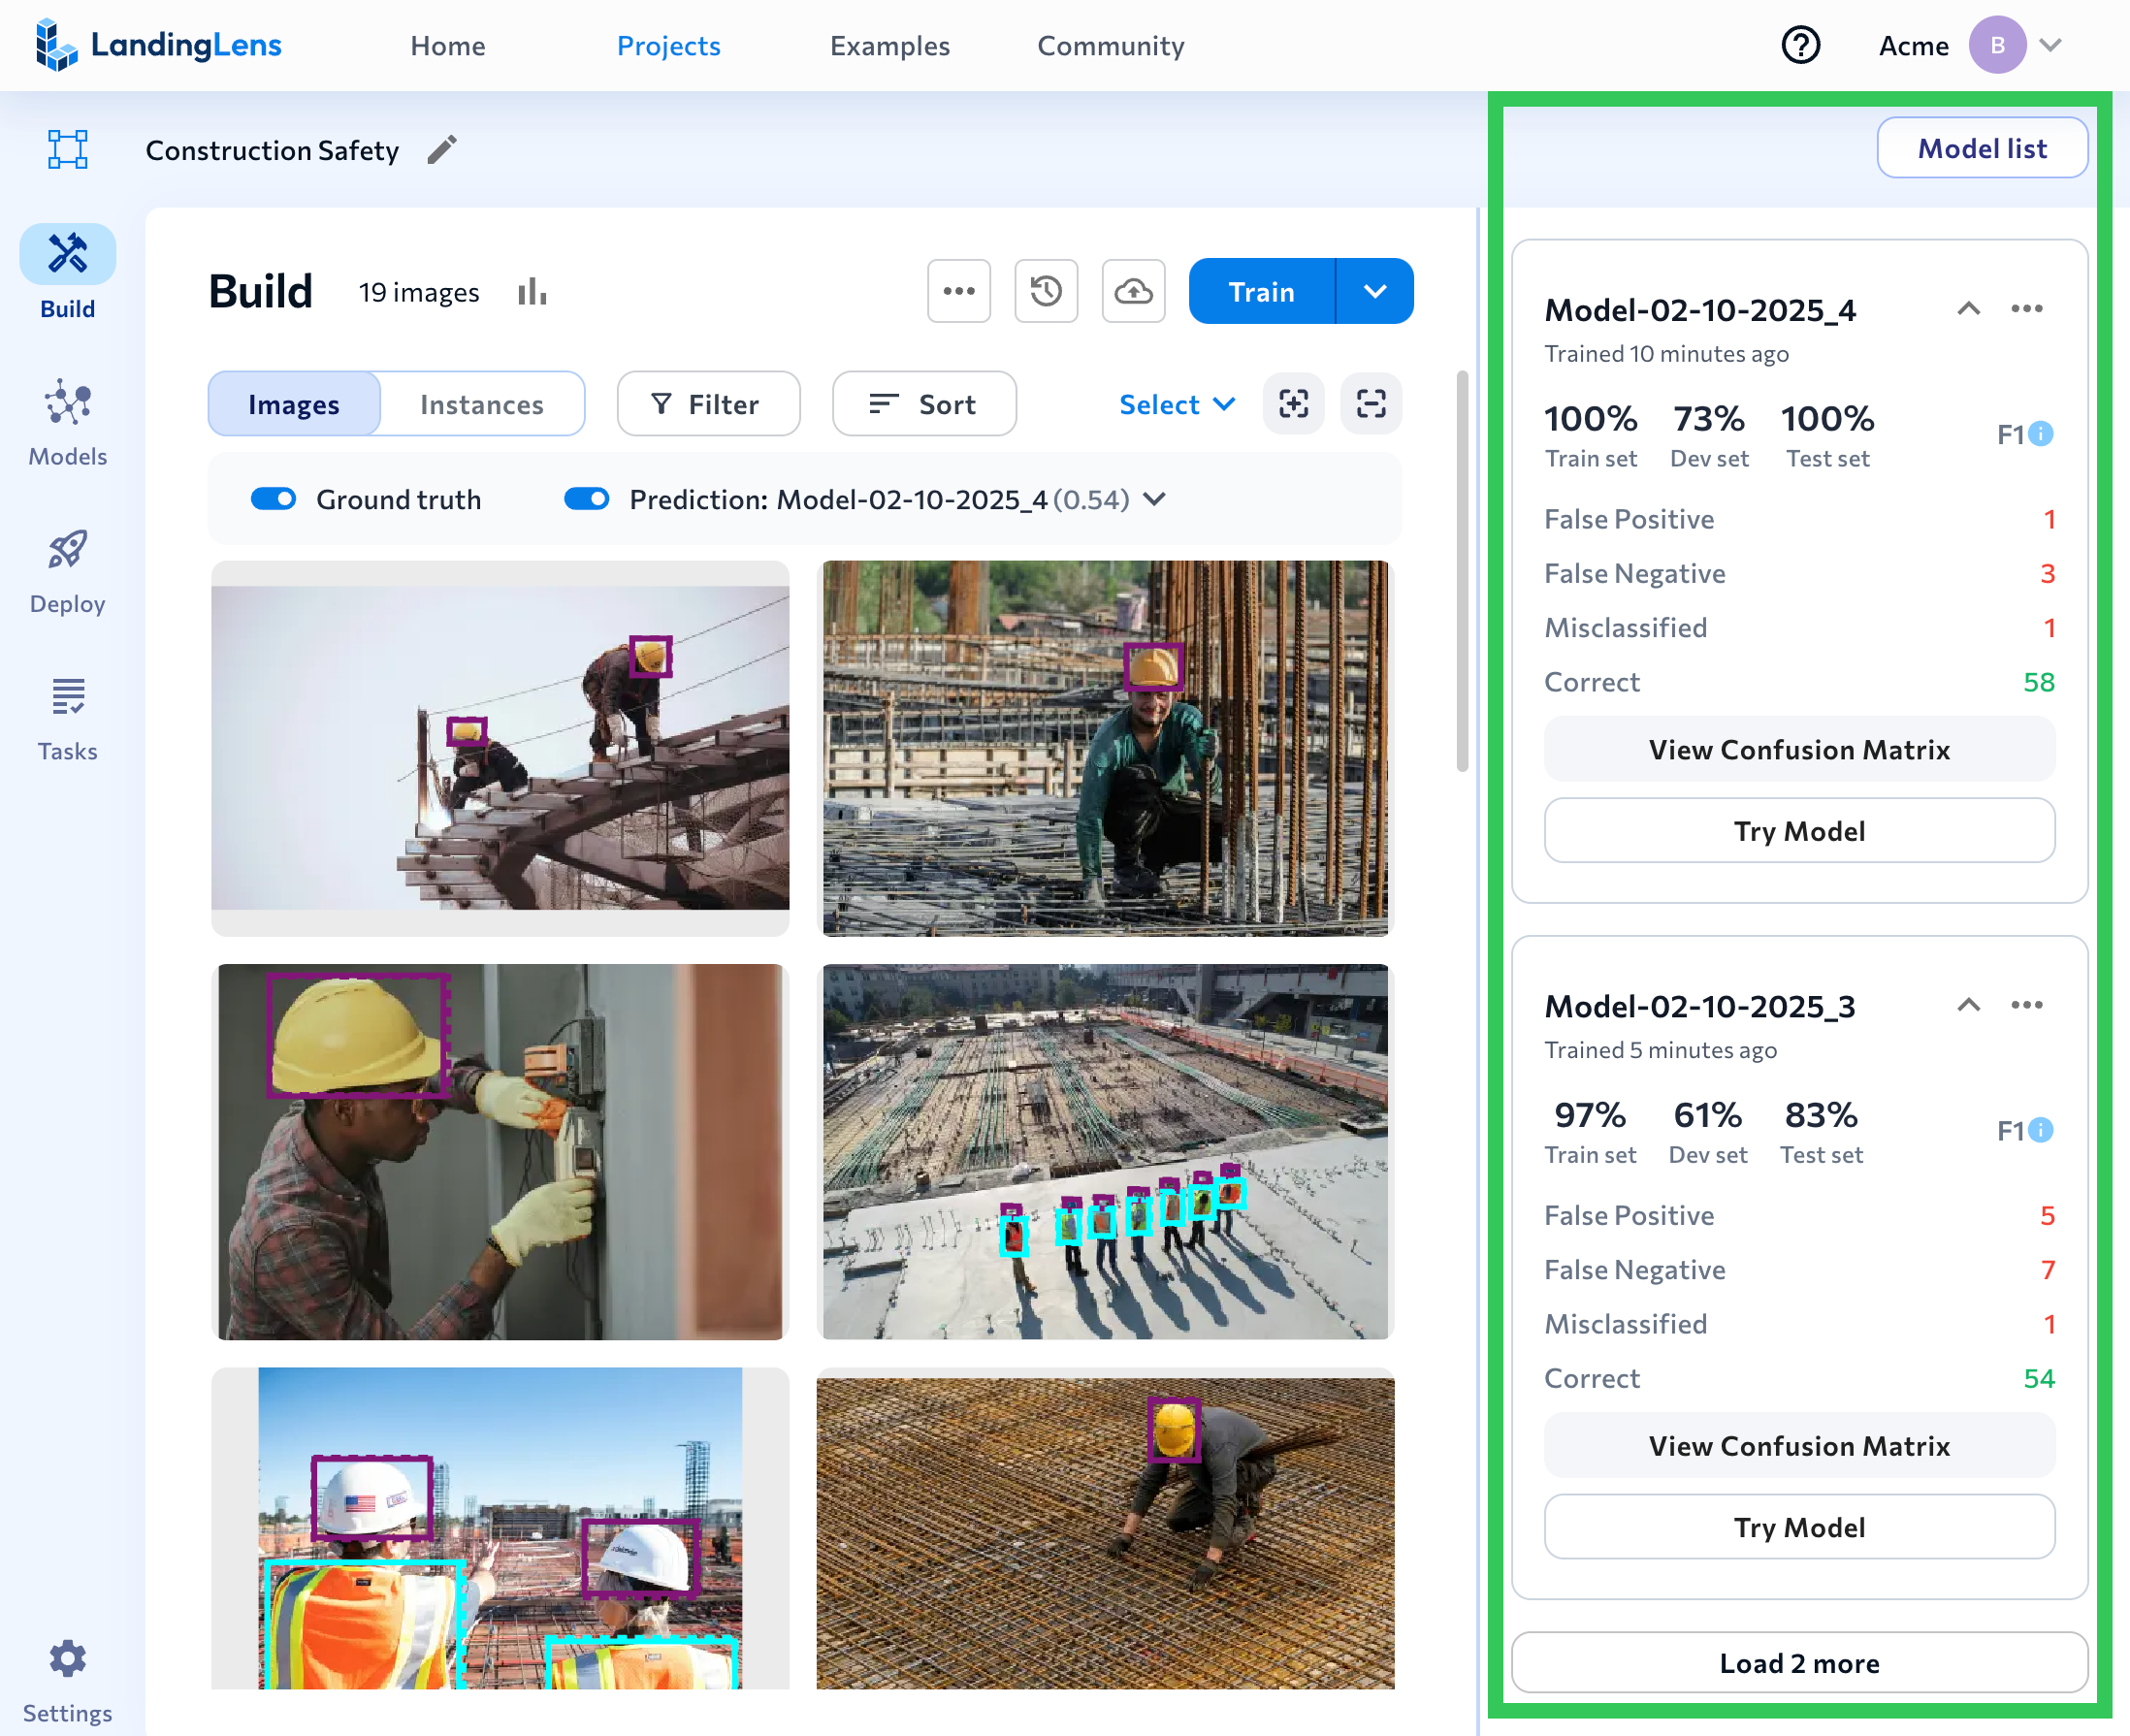
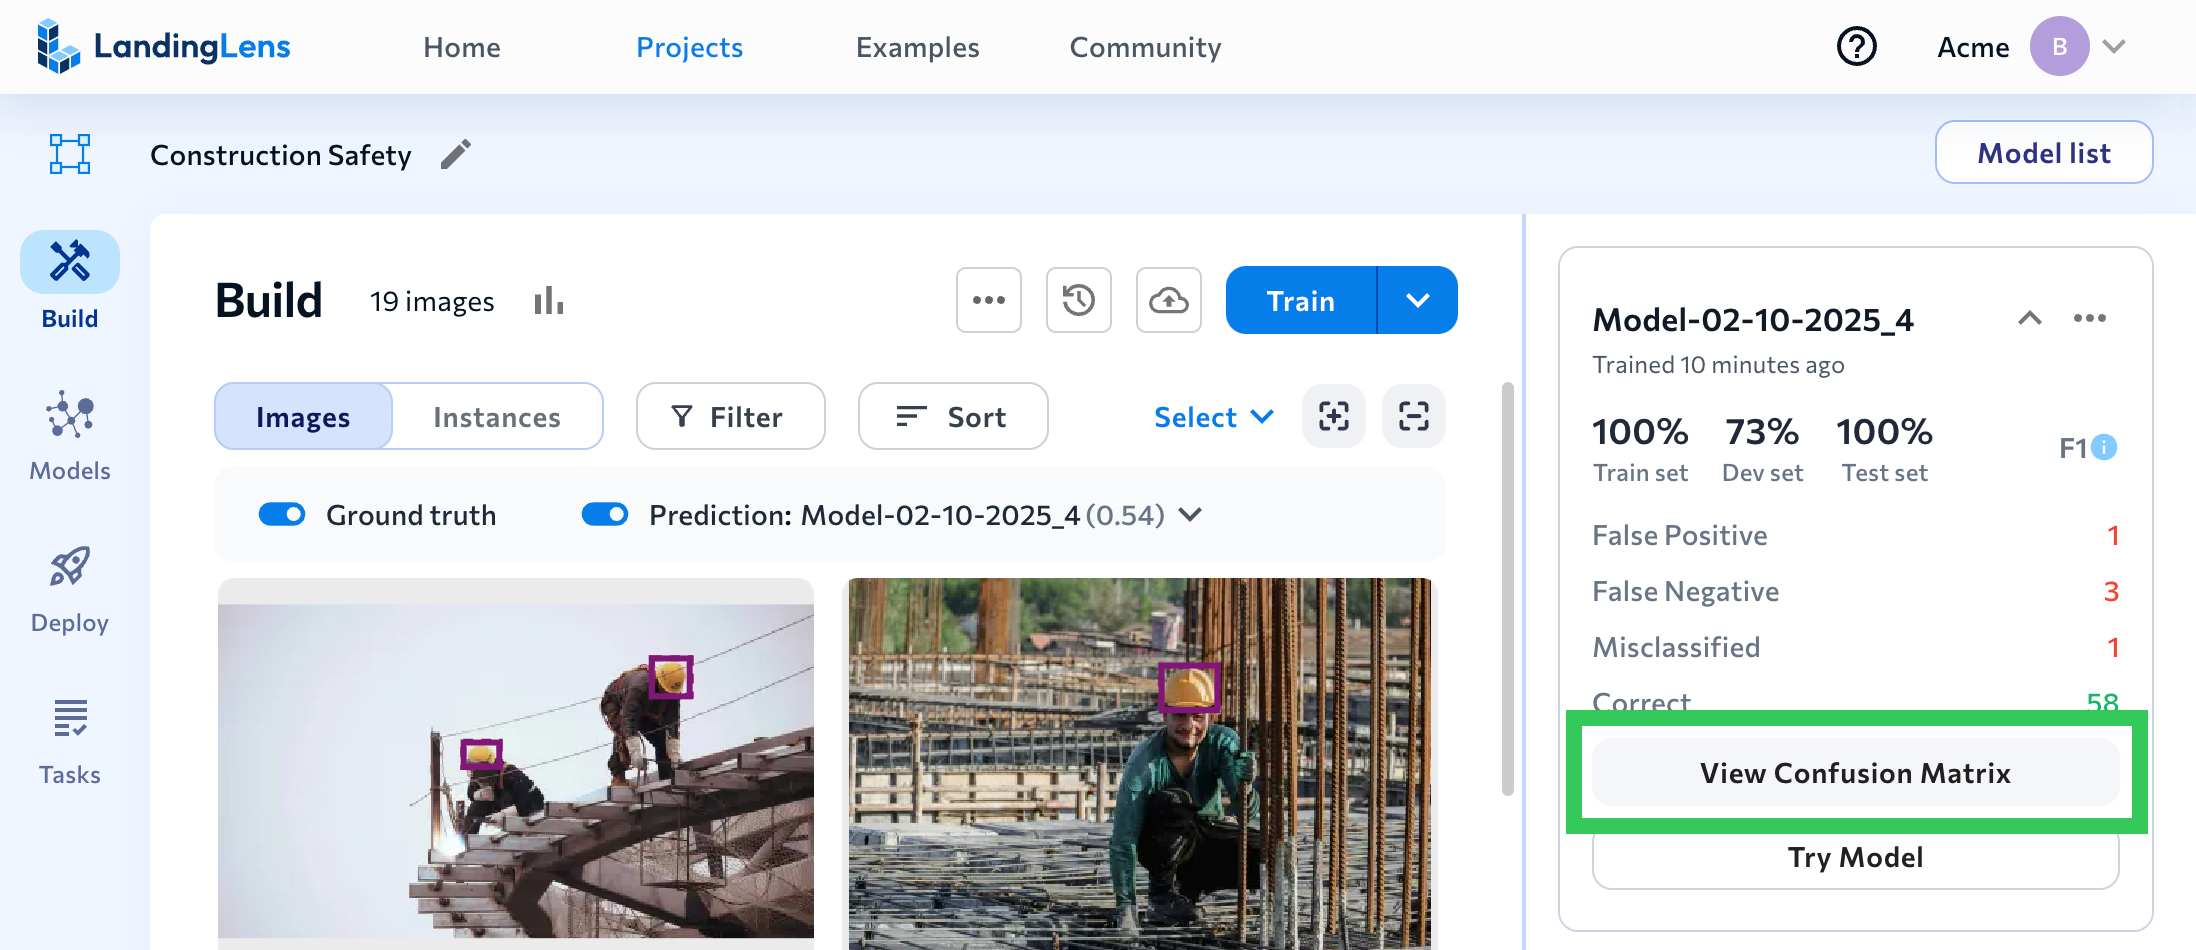
Each model you train in a project displays as a tile in the **Model List** on the right of the **Build** page. Each model tile shows high-level performance metrics, including the F1 or IoU score for each split.
## Analyze Model Performance
Watch the following video to learn how to use the model report metrics and confusion matrix to analyze and improve model performance.
## Model List Overview
Here's a quick introduction to the elements of the Model List:
| # | Item | Description |
\| --- | --- | --- |
\| 1 | Model List | Click the **Model List** button to show/hide the model tiles. |
\| 2 | Name | The model name. |
\| 3 | Performance scores for splits | The performance score for each split. Object Detection, Classification, and Anomaly Detection projects show the [F1 score](./model-settings#object-detection-and-classification-f1-score). Segmentation projects show the [Intersection over Union (IoU) score](./model-settings#segmentation-intersection-over-union-iou). |
\| 4 | More Actions | Click the **Actions** icon (**...**) to access these tools or shortcuts: [Download CSV](./model-settings#download-csv-model-performance-for-each-image-in-dataset), [View on Models Page](./model-settings#view-on-models-page), [Go to Snapshot Page](./model-settings#go-to-snapshot-page). |
\| 5 | Predictions | The number of times the model made each of these predictions: False Positive, False Negative, Misclassified, and Correct. (Some predictions aren't applicable to certain project types.)
For Segmentation projects, the number is the number of *pixels*. |
\| 6 | View Confusion Matrix | Click [View Confusion Matrix](./model-settings#view-confusion-matrix) to see the model performance metrics and confusion matrix. The data is based on the dataset that the model was trained on. |
\| 7 | Try Model | Click [Try Model](./model-settings#try-model) to see how the model performs on new images. |
\| 8 | Collapse and expand tile | Click to show/hide the predictions. |
\| 9 | Load more models | Click the **Load** button to show more model tiles. |
## View Confusion Matrix
Click **View Confusion Matrix** to see the model [performance](./model-settings#performance) metrics and [confusion matrix](./model-settings#confusion-matrix).
### Performance
The **Performance** section shows how the model performed on the Train, Dev, and Test sets (see more information about [splits](./splits) here). The number in parentheses is the number of images in the split.
For Object Detection, Segmentation, and Anomaly Detection projects, the scores are based on the confidence threshold that displays. This is the confidence threshold with the best F1 score for all labeled data.
The Performance score unit depends on the project type:
* [Object Detection, Classification, Anomaly Detection: F1 Score](./model-settings#object-detection-classification-anomaly-detection-f1-score)
* [Segmentation: Intersection Over Union (IoU)](./model-settings#segmentation-intersection-over-union-iou)
#### Object Detection, Classification, Anomaly Detection: F1 Score
The Performance section for Object Detection, Classification, and Anomaly Detection projects shows the F1 score for each split.
For **Object Detection**, the F1 score combines precision and recall into a single score, creating a unified measure that assesses the model’s effectiveness in minimizing false positives and false negatives. A higher F1 score indicates the model is balancing the two factors well. LandingLens uses micro-averaging to calculate the F1 score.
For **Classification** and **Anomaly Detection**, the F1, Precision, and Recall scores are identical. This is because these models have only two prediction outcomes: "Correct" and "Misclassified". Therefore, the F1, Precision, and Recall scores for these models are all calculated using this algorithm:
$$
\frac{Corrects}{Misclassifieds}
$$
#### Segmentation: Intersection Over Union (IoU)
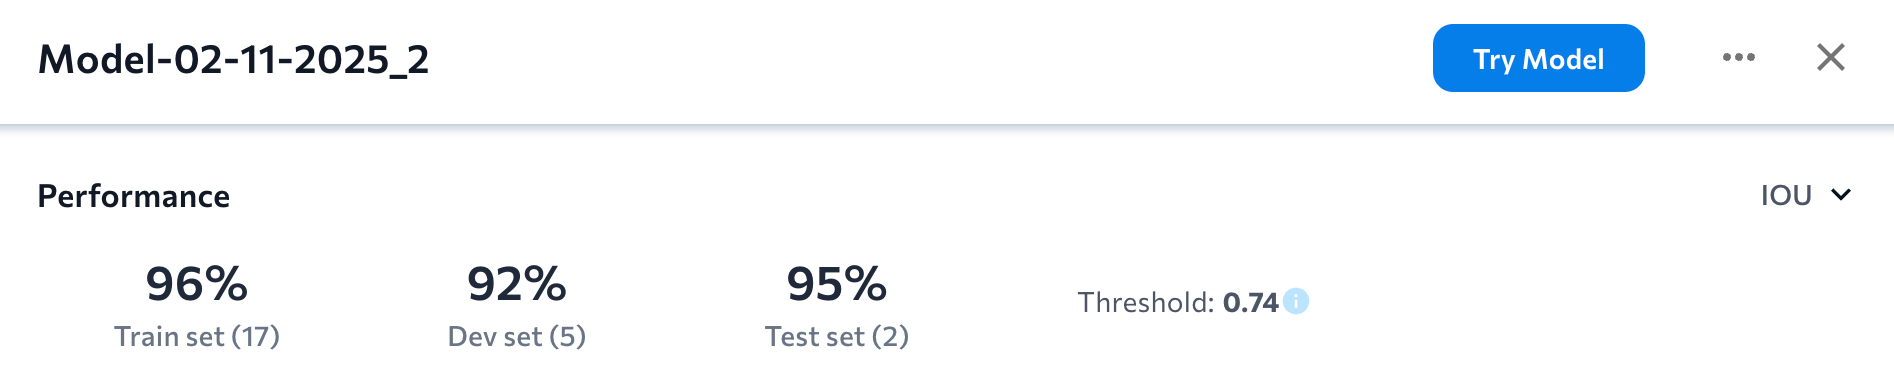
The Performance section for Segmentation projects shows the Intersection over Union (IoU) score for each split.
Intersection over Union (IoU) is used to measure the accuracy of the model by measuring the overlap between the predicted and actual masks in an image. A higher IoU indicates better agreement between the ground truth and predicted mask. LandingLens does not include the implicit background and micro-averaging in the calculation of the IoU.
#### Precision
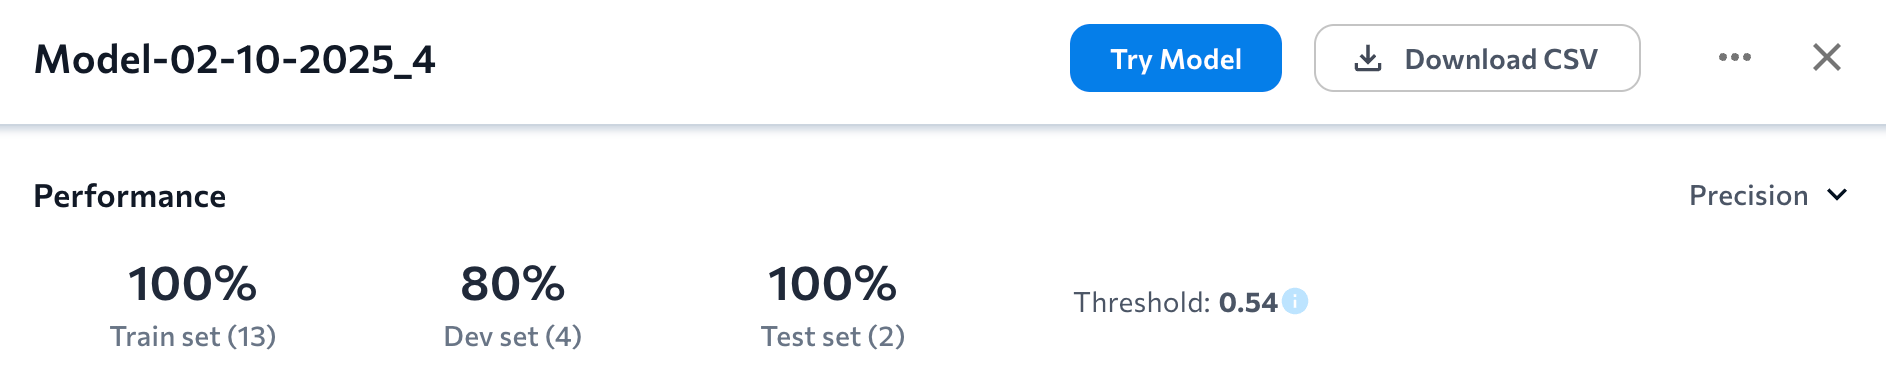
Select **Precision** from the drop-down in the **Performance** section to see the Precision scores for each split.
**Precision** is the model’s ability to be accurate when it says something is true. Precision answers the natural language question, “When the model makes a prediction, how often is it correct?” This metric shows how accurate the model predictions are. The higher the Precision score, the more accurate the predictions are.
For **Object Detection** and **Segmentation**, Precision is calculated using this algorithm:
$$
Precision = \frac{TruePositives}{TruePositives + FalsePositives}
$$
For **Classification** and **Anomaly Detection**, the F1, Precision, and Recall scores are identical. This is because these models have only two prediction outcomes: "Correct" and "Misclassified". Therefore, the F1, Precision, and Recall scores for these models are all calculated using this algorithm:
$$
\frac{Corrects}{Misclassifieds}
$$
#### Recall
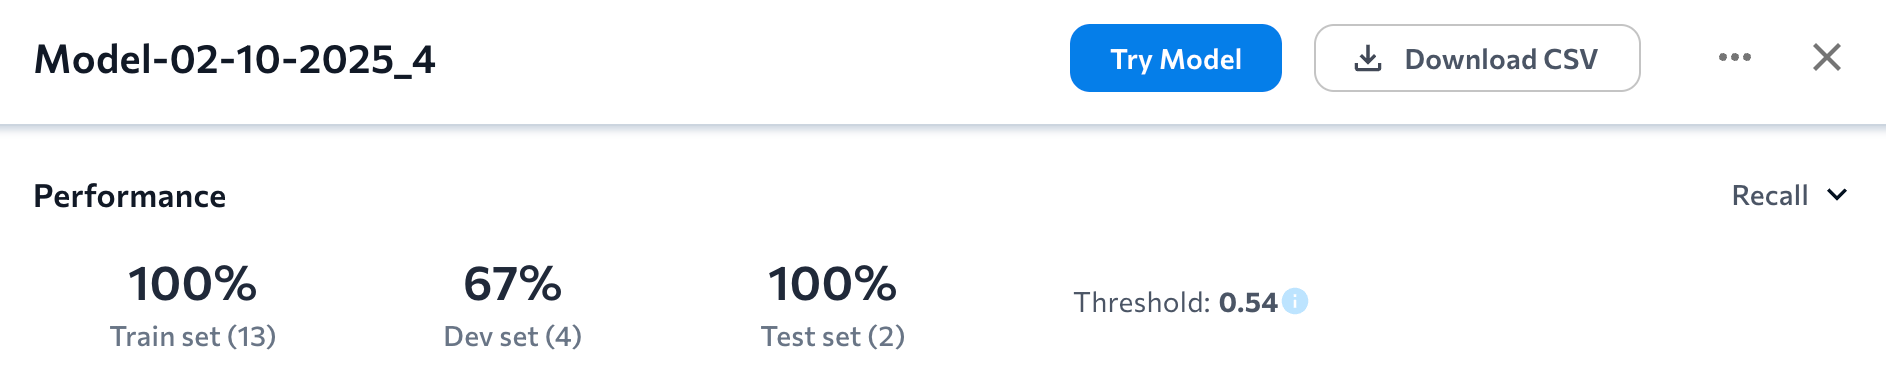
Select **Recall** from the drop-down in the **Performance** section to see the Recall scores for each split.
**Recall** is the model’s ability to find all objects of interest. Recall answers the natural language question, “Of all the labels (ground truths) in the dataset, what percent of them are found by the model?” It conveys how accurately the model can correctly identify all the actual positive instances in the dataset. The higher the Recall score, the lower the chance the model will have a false negative.
For **Object Detection** and **Segmentation**, Recall is calculated using this algorithm:
$$
Recall = \frac{TruePositives}{TruePositives + FalseNegatives}
$$
For **Classification** and **Anomaly Detection**, the F1, Precision, and Recall scores are identical. This is because these models have only two prediction outcomes: "Correct" and "Misclassified". Therefore, the F1, Precision, and Recall scores for these models are all calculated using this algorithm:
$$
\frac{Corrects}{Misclassifieds}
$$
### Confusion Matrix
Click **View Confusion Matrix** on a model tile to see the confusion matrix.
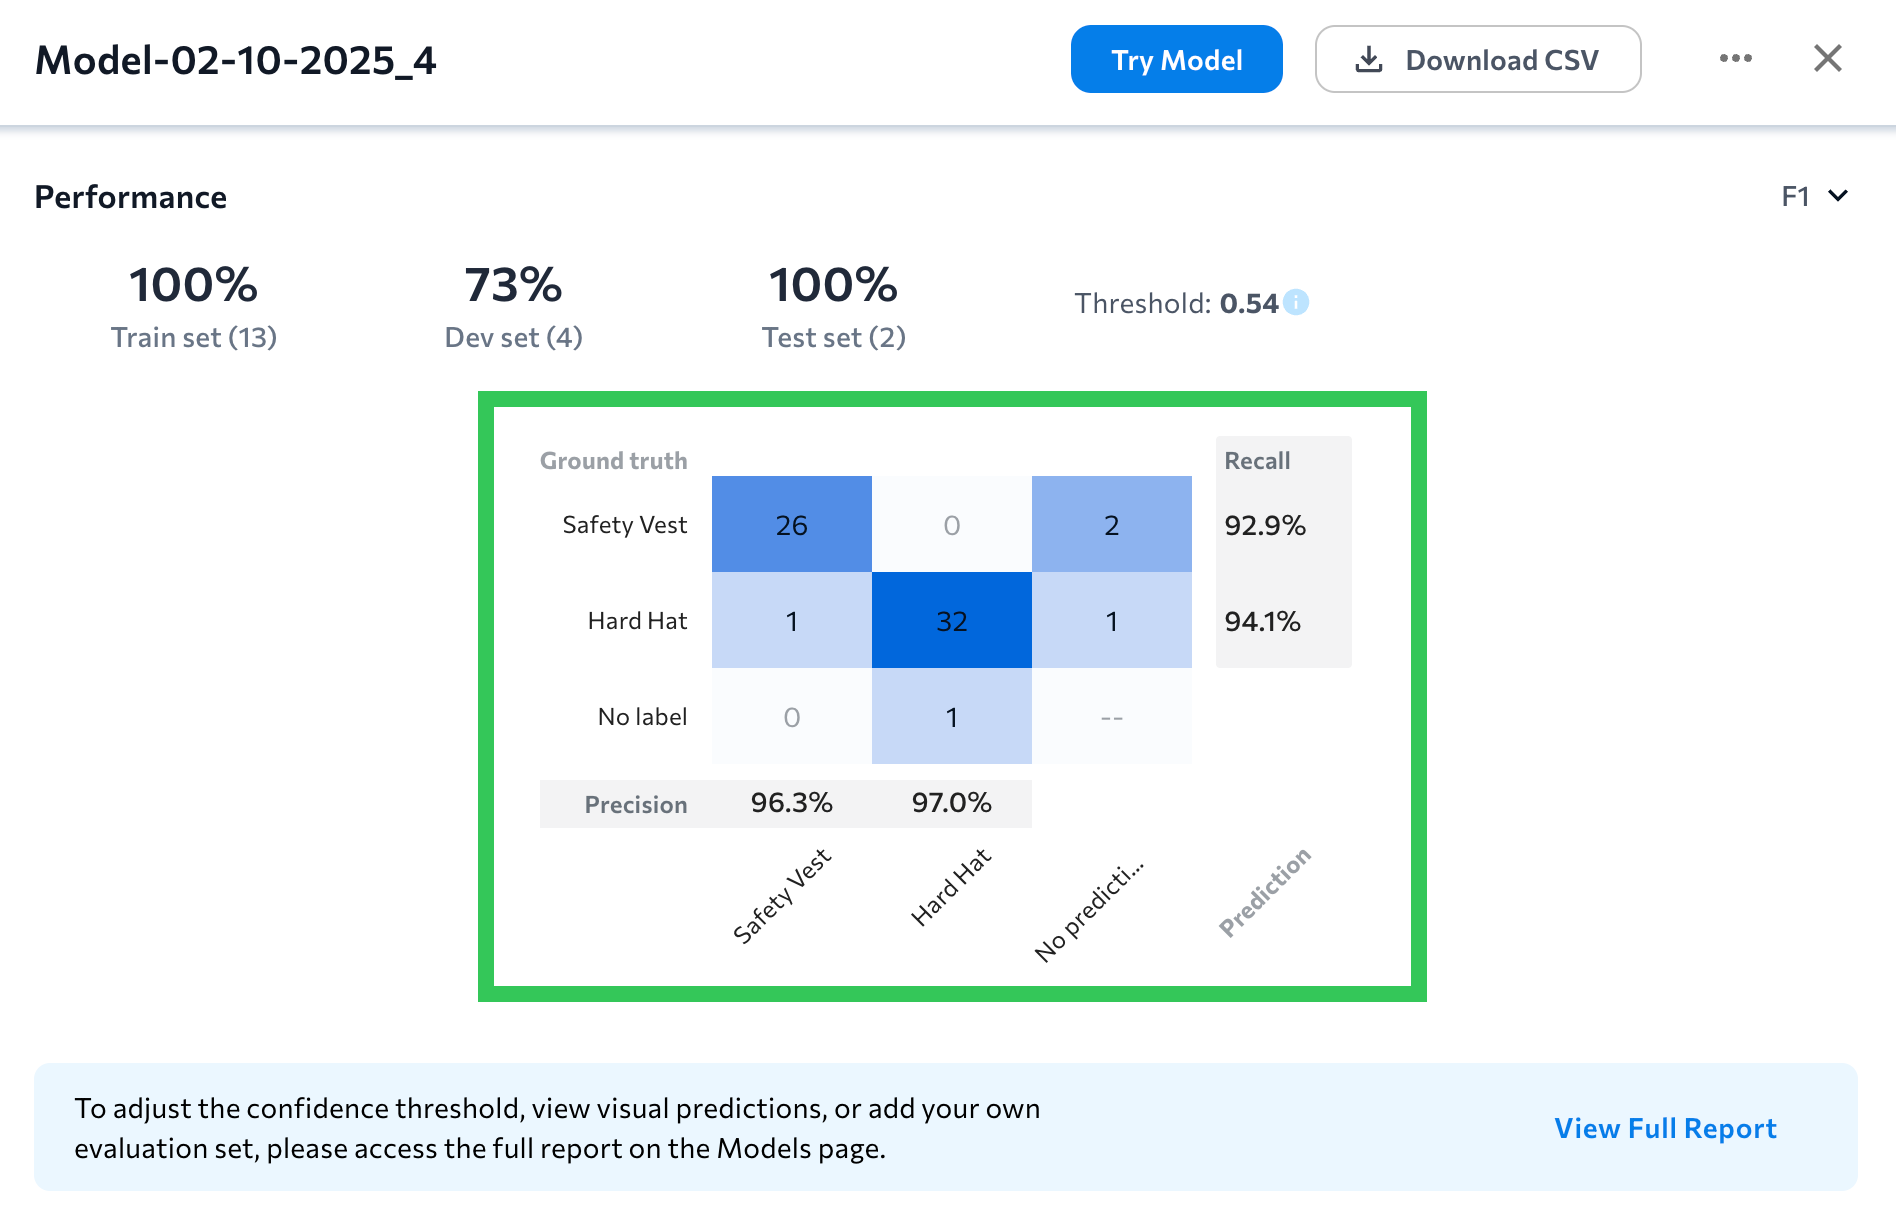
The confusion matrix counts ground truth labels versus model predictions. The confusion matrix shown here is for the *dataset that the model was trained on*.
The y-axis represents each ground truth label. The x-axis represents each possible model prediction.
Each cell shows the count of instances that correspond to a particular ground truth class-predicted class pair. For example, in the image below, the model correctly predicted the class "Hard Hat" 32 times and misclassified it 2 times.
### Precision Score for Class
The Precision score for each class is listed along the x-axis. Precision answers the natural language question, “When the model predicts Class A, how often is it correct?”
The Precision score for a class is the percentage of instances that the model correctly predicted the class out of all instances that the model predicted the class, and is calculated using this equation:
$$
Precision_A = \frac{TruePositives_A}{TruePositives_A + FalsePositives_A}
$$
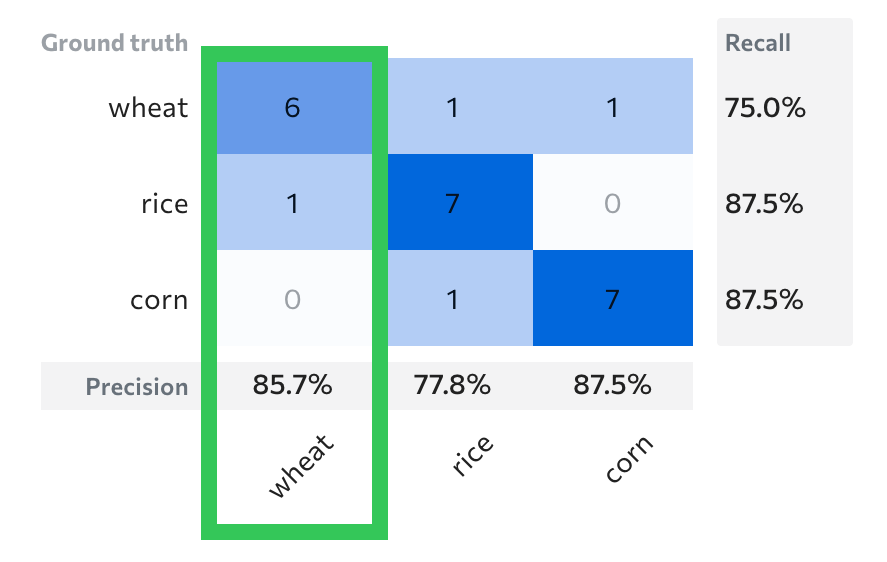
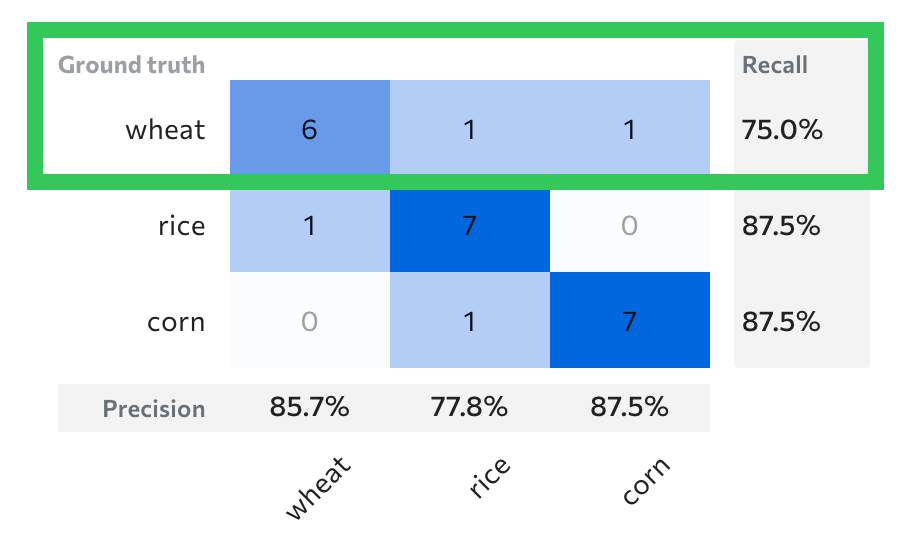
For example, let’s calculate the Precision score for the Wheat class in the image below. The model predicts Wheat 7 times. Of those, 6 are correct (True Positives) and 1 is incorrect (False Positives). When we plug those numbers into the Precision equation, we see that the Precision for this class is 85.7%.
$$
= \displaystyle\frac{6}{6 + 1}
$$
$$
= 85.7\%
$$
### Recall Score for Class
The Recall score for each class is listed along the y-axis. Recall answers the natural language question, “Of all the Class As in the dataset, what percent of them are found by the model?”
The Recall score for a class is the percentage of instances that the model correctly predicted the class out of all actual instances of the class, and is calculated using this equation:
$$
Recall_A = \frac{TruePositives_A}{TruePositives_A + FalseNegatives_A}
$$
For example, let’s calculate the Recall score for the Wheat class in the image below. The dataset has 8 instances of Wheat. The model predicts 6 instances correctly (True Positives) and 2 instances incorrectly (False Negatives). When we plug those numbers into the Recall equation, we see that the Recall for this class is 75.0%.
$$
= \displaystyle\frac{6}{6 + 2}
$$
$$
= 75.0\%
$$
### Use Colors to Help Interpret Performance
Each cell has a color that can quickly help you identify correct classifications and errors. Darker colors indicate a higher number, and lighter colors indicate a lower number.
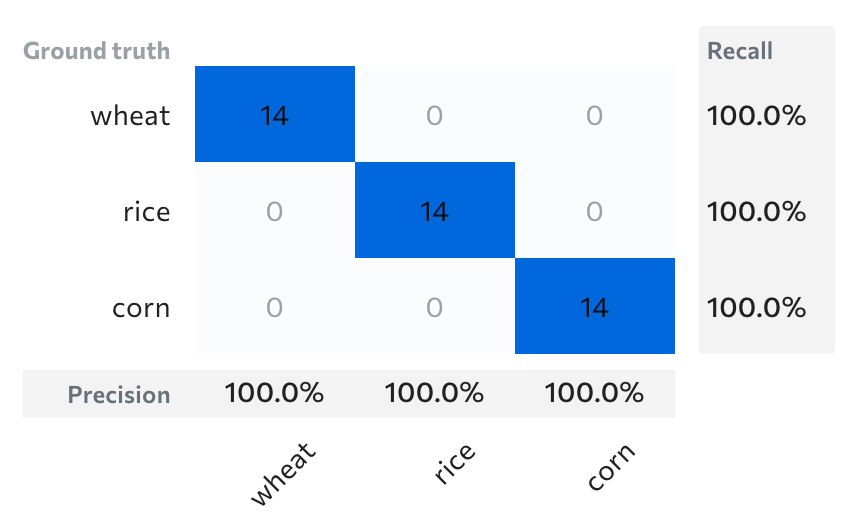
For example, if the model correctly predicts all instances, only the cells on the diagonal will be blue and have non-zero values. See the following image as an example.
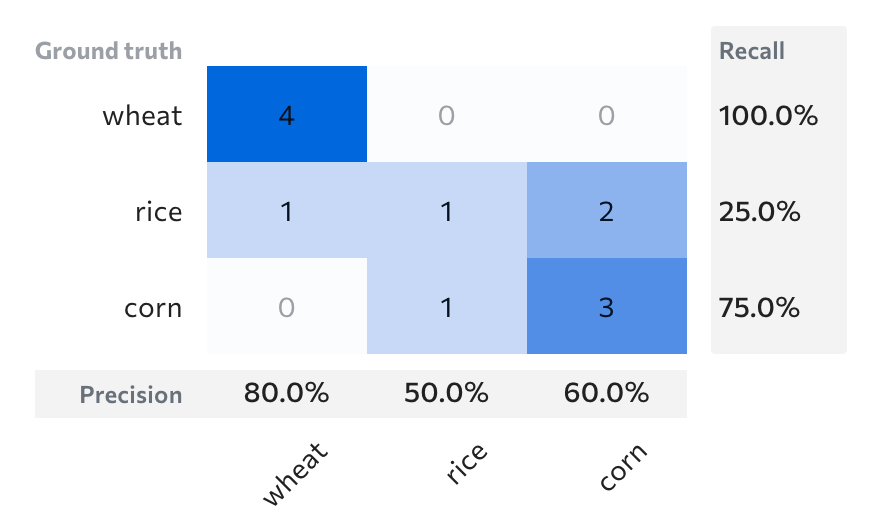
If any off-diagonal cells contain values, start by looking for the darker colors to understand where the model is making errors. For example, let’s say you want to evaluate performance for the Rice class using the confusion matrix below. The model correctly predicted 1 instance and misclassified 3 instances. Consider looking at the instances that were misclassified as Corn first, since that cell is darker (and has a higher number) than the Wheat cell.
## Try Model
After you train a model, you can test its performance by using the **Try Model** tool. Using Try Model is a good way to "spot-check" a model's performance.
When you click **Try Model**, you can upload a few images to see how the model performs on them. Ideally, you should upload images that aren't already in the dataset and that match your real-world use case. If the model performs well on the new images, you can [deploy it](./deployment-options). If the model doesn't perform well on the images, try uploading and labeling more images in your project. Then run Try Model again.
The Try Model tool runs inference on each image, so using this tool costs 1 credit per image. (The credit cost is not applicable when using {llsf}.)
To use **Try Model**:
1. Open a project to the **Build** tab.
2. Click **Model List** to view all models in the project.
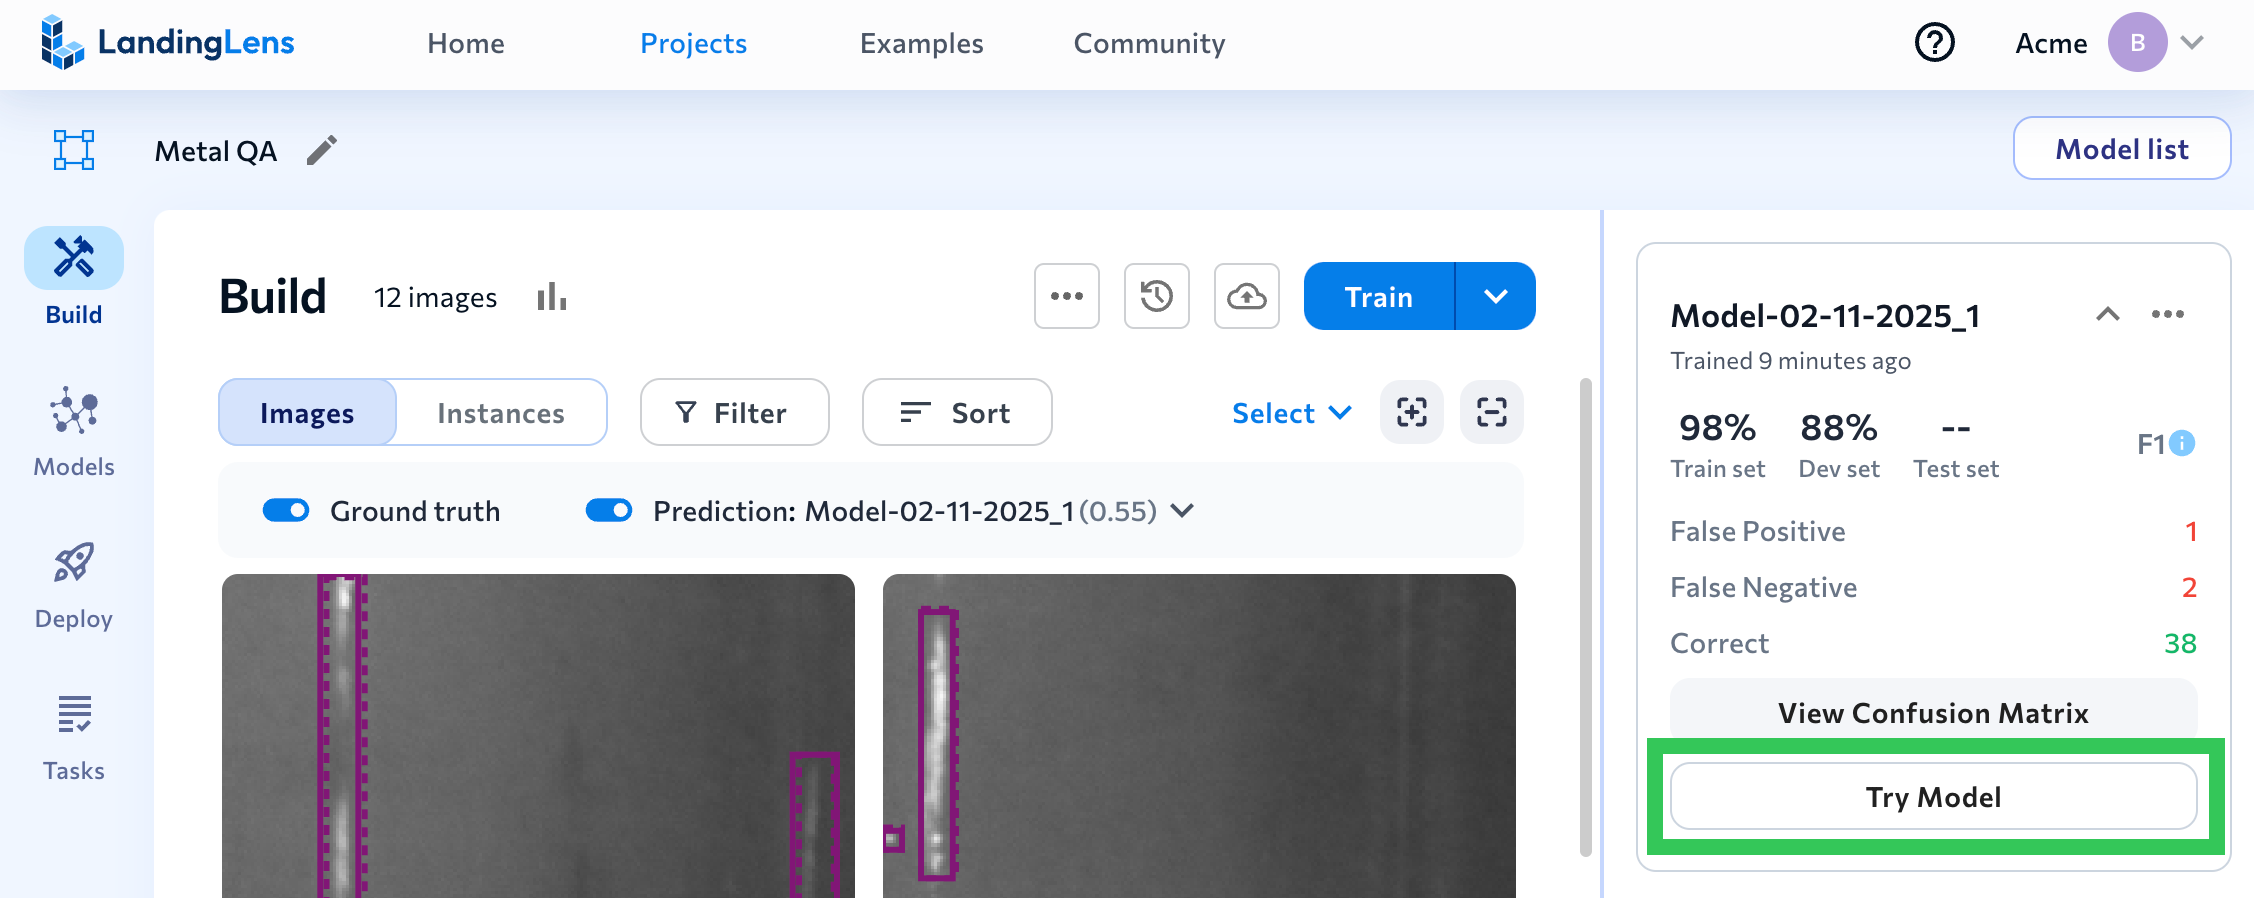
3. Click **Try Model** on the model you want to use. (You can also click a model tile to open the model, and then click **Try Model**.)
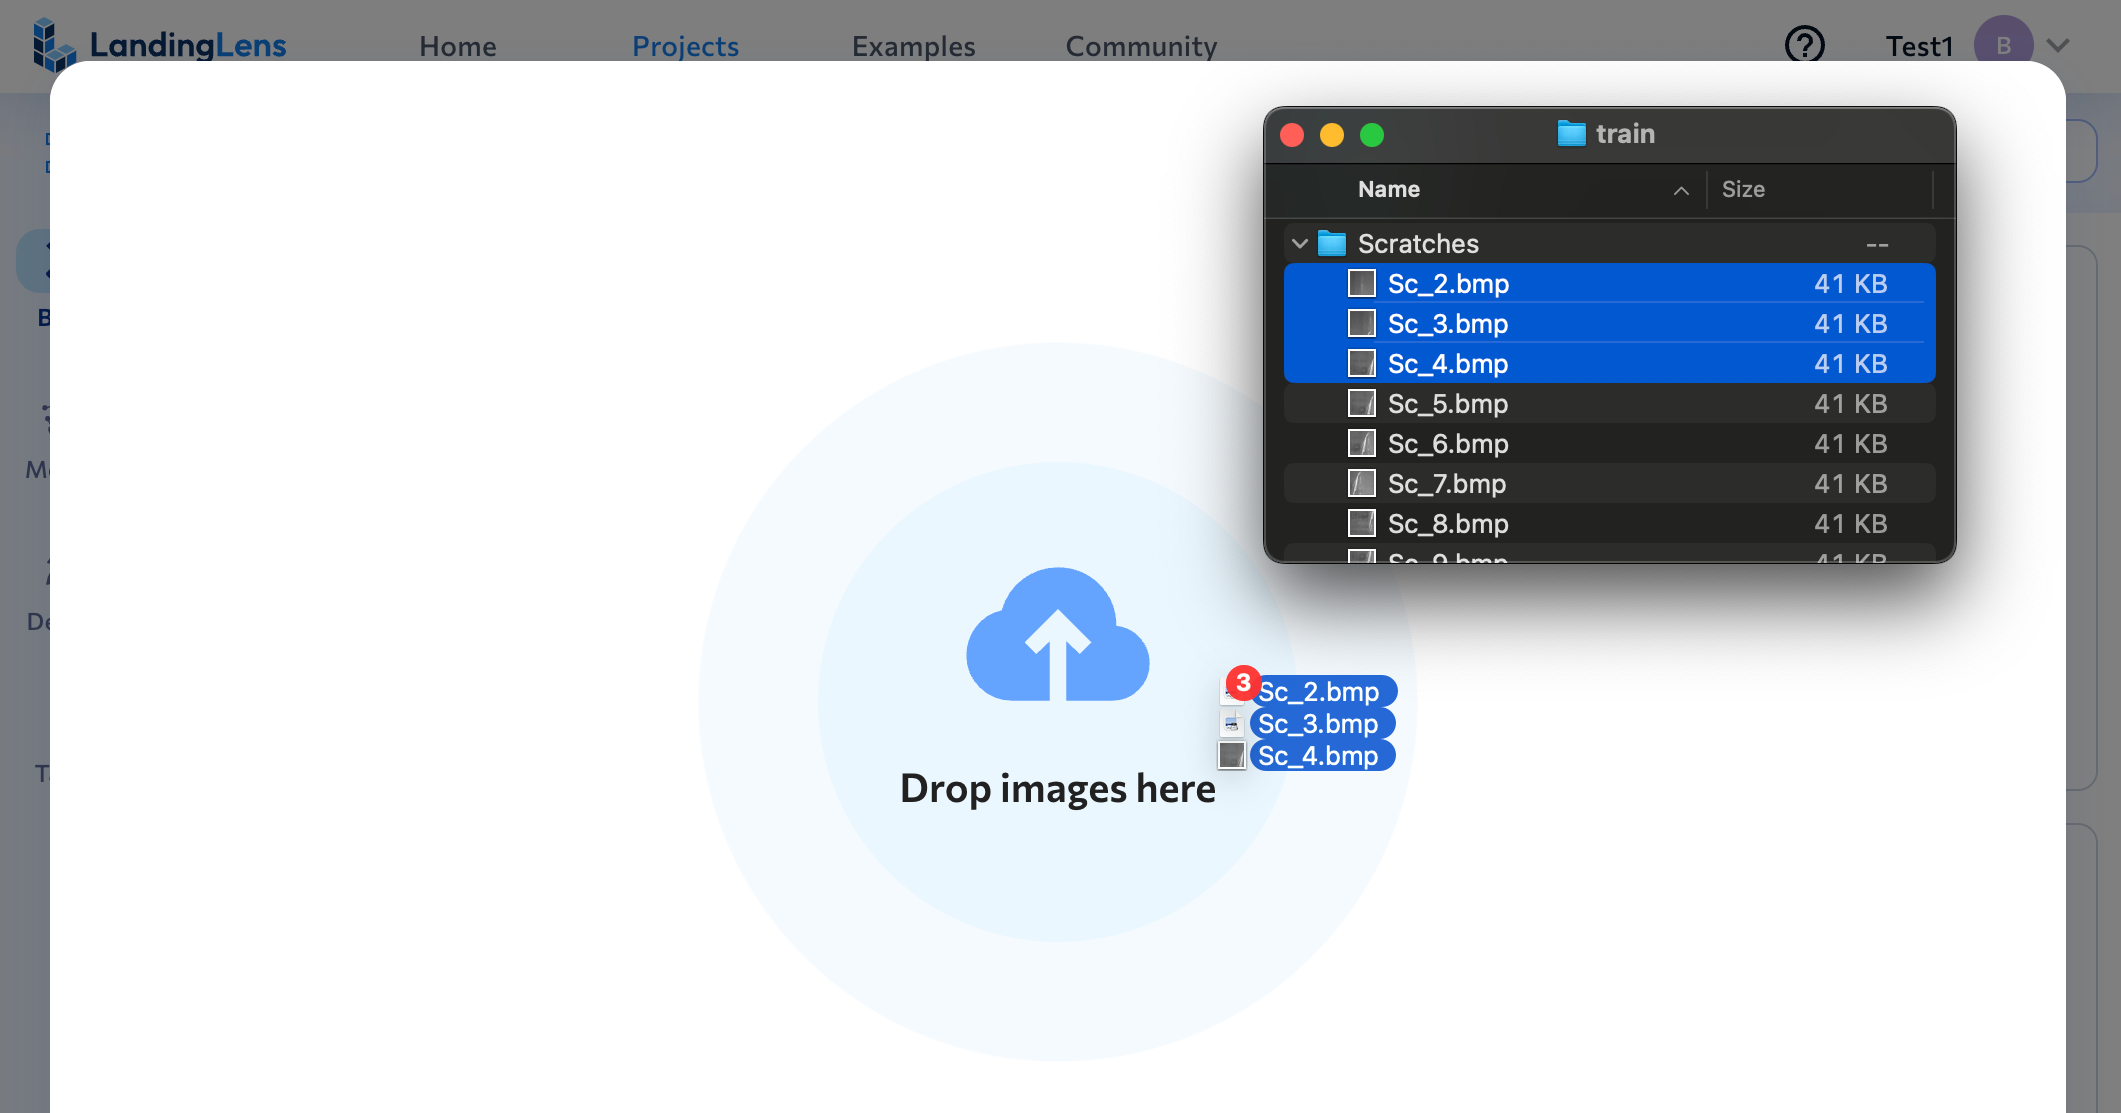
4. Upload images.
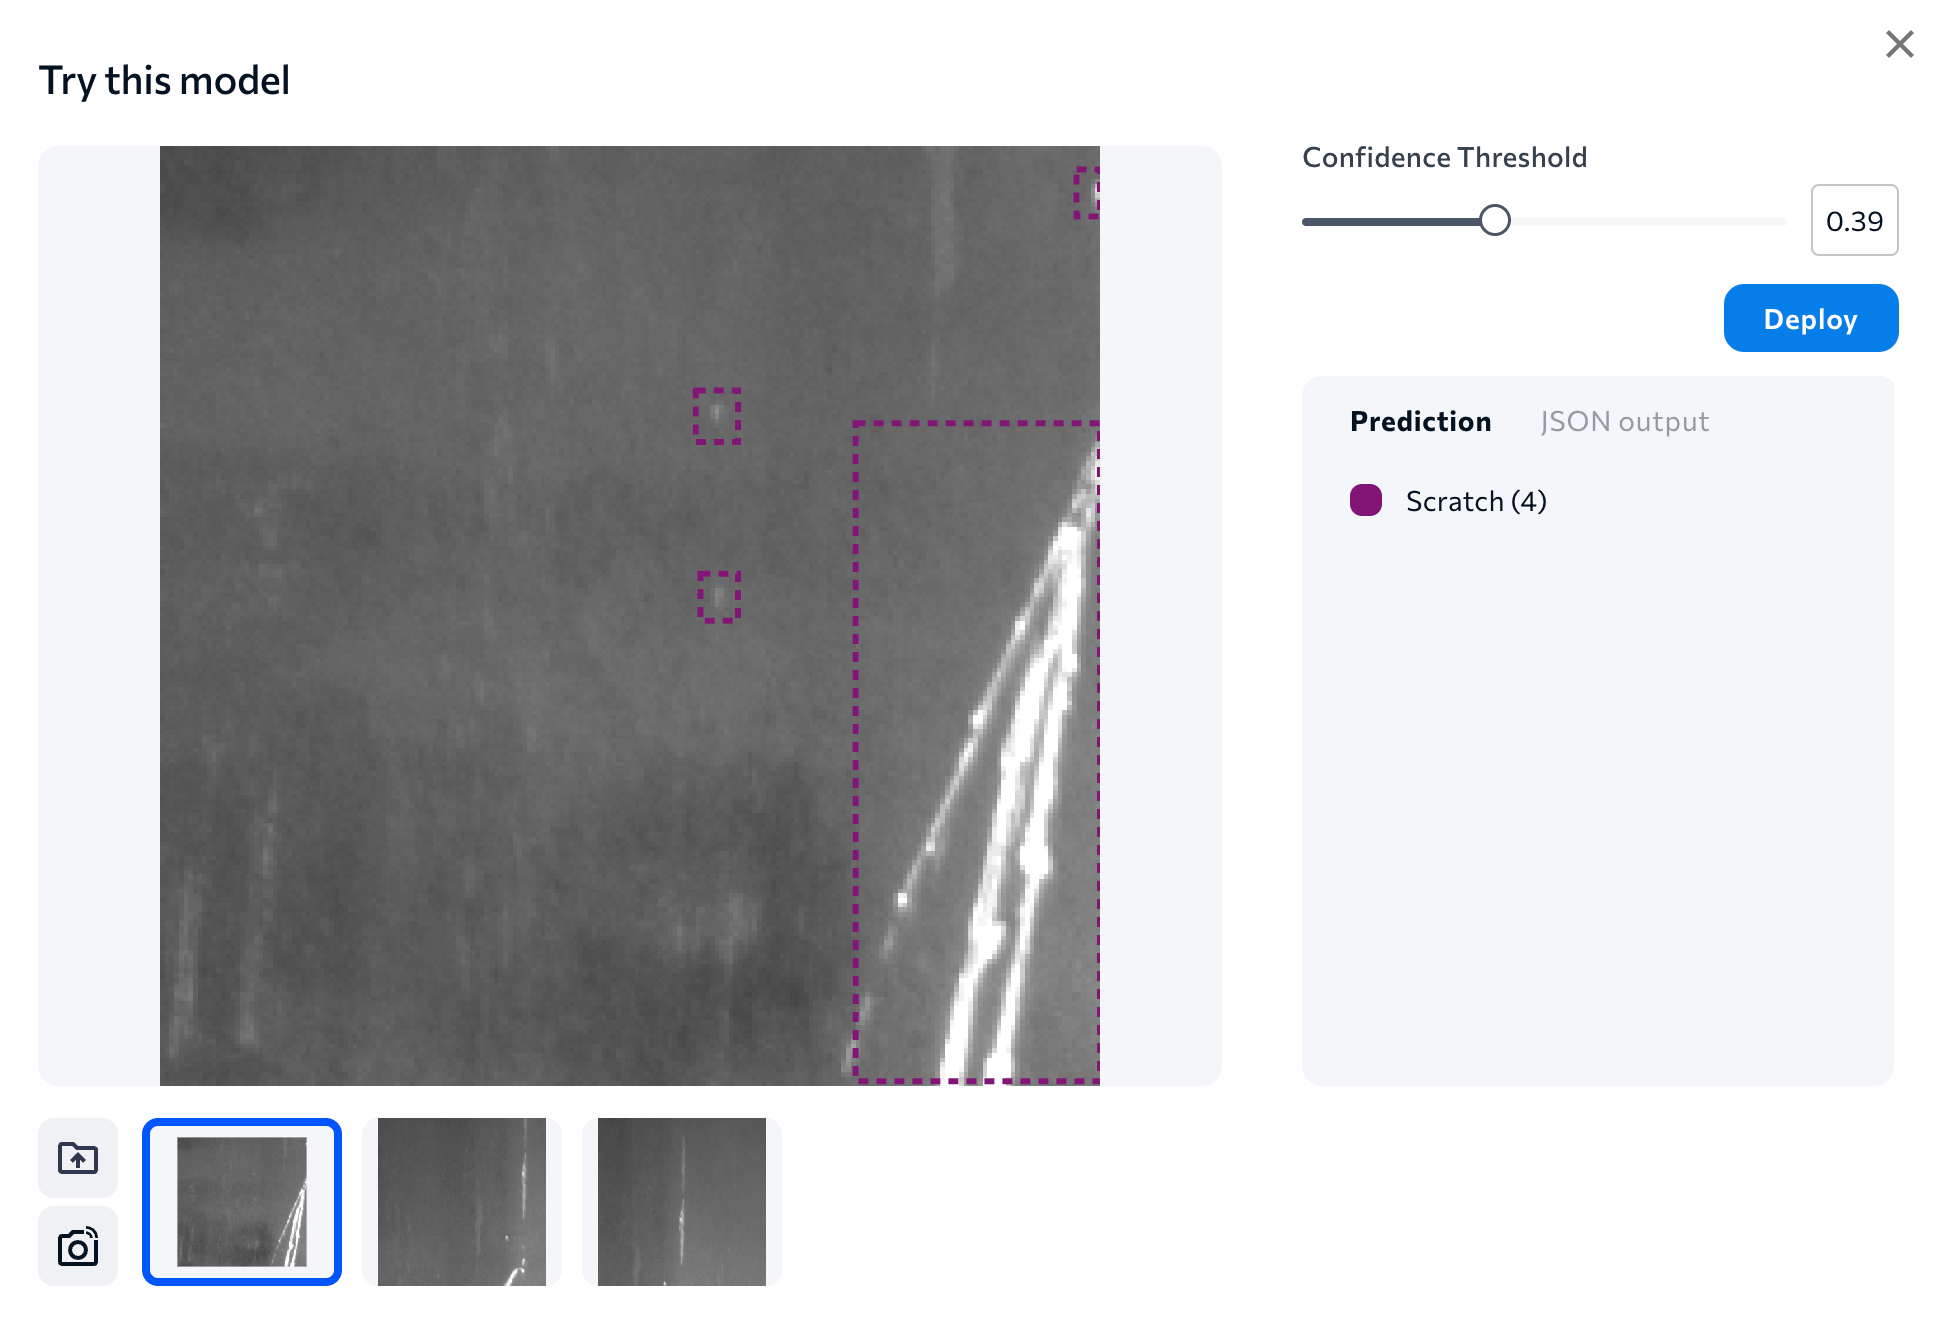
5. LandingLens runs the model and shows you the results. Adjust the **Confidence Threshold** slider (for Object Detection and Segmentation) or **Anomaly Threshold** slider (for Anomaly Detection) to see how the model performs with different thresholds. Typically, a lower threshold means that you will see more predictions, while a higher threshold means you will see fewer.
## Download CSV of Model Predictions
For Object Detection and Classification projects, you can download a CSV that shows the ground truth labels and model predictions for images. You can download the CSV:
* [For images in a model dataset](./model-settings#download-csv-model-predictions-for-images-in-a-model-dataset)
* [For select images](./model-settings#download-csv-model-predictions-for-select-images)
### Download CSV: Model Predictions for Images in a Model Dataset
You can download a CSV of model predictions for the dataset of images that a model was trained on. This is available for Object Detection and Classification projects.
The prediction data in the CSV will be based on the selected model and its default confidence threshold.
To download the CSV for images in a model's dataset:
1. Open a project to the **Build** tab.
2. Click **Model List** to view all models in the project.
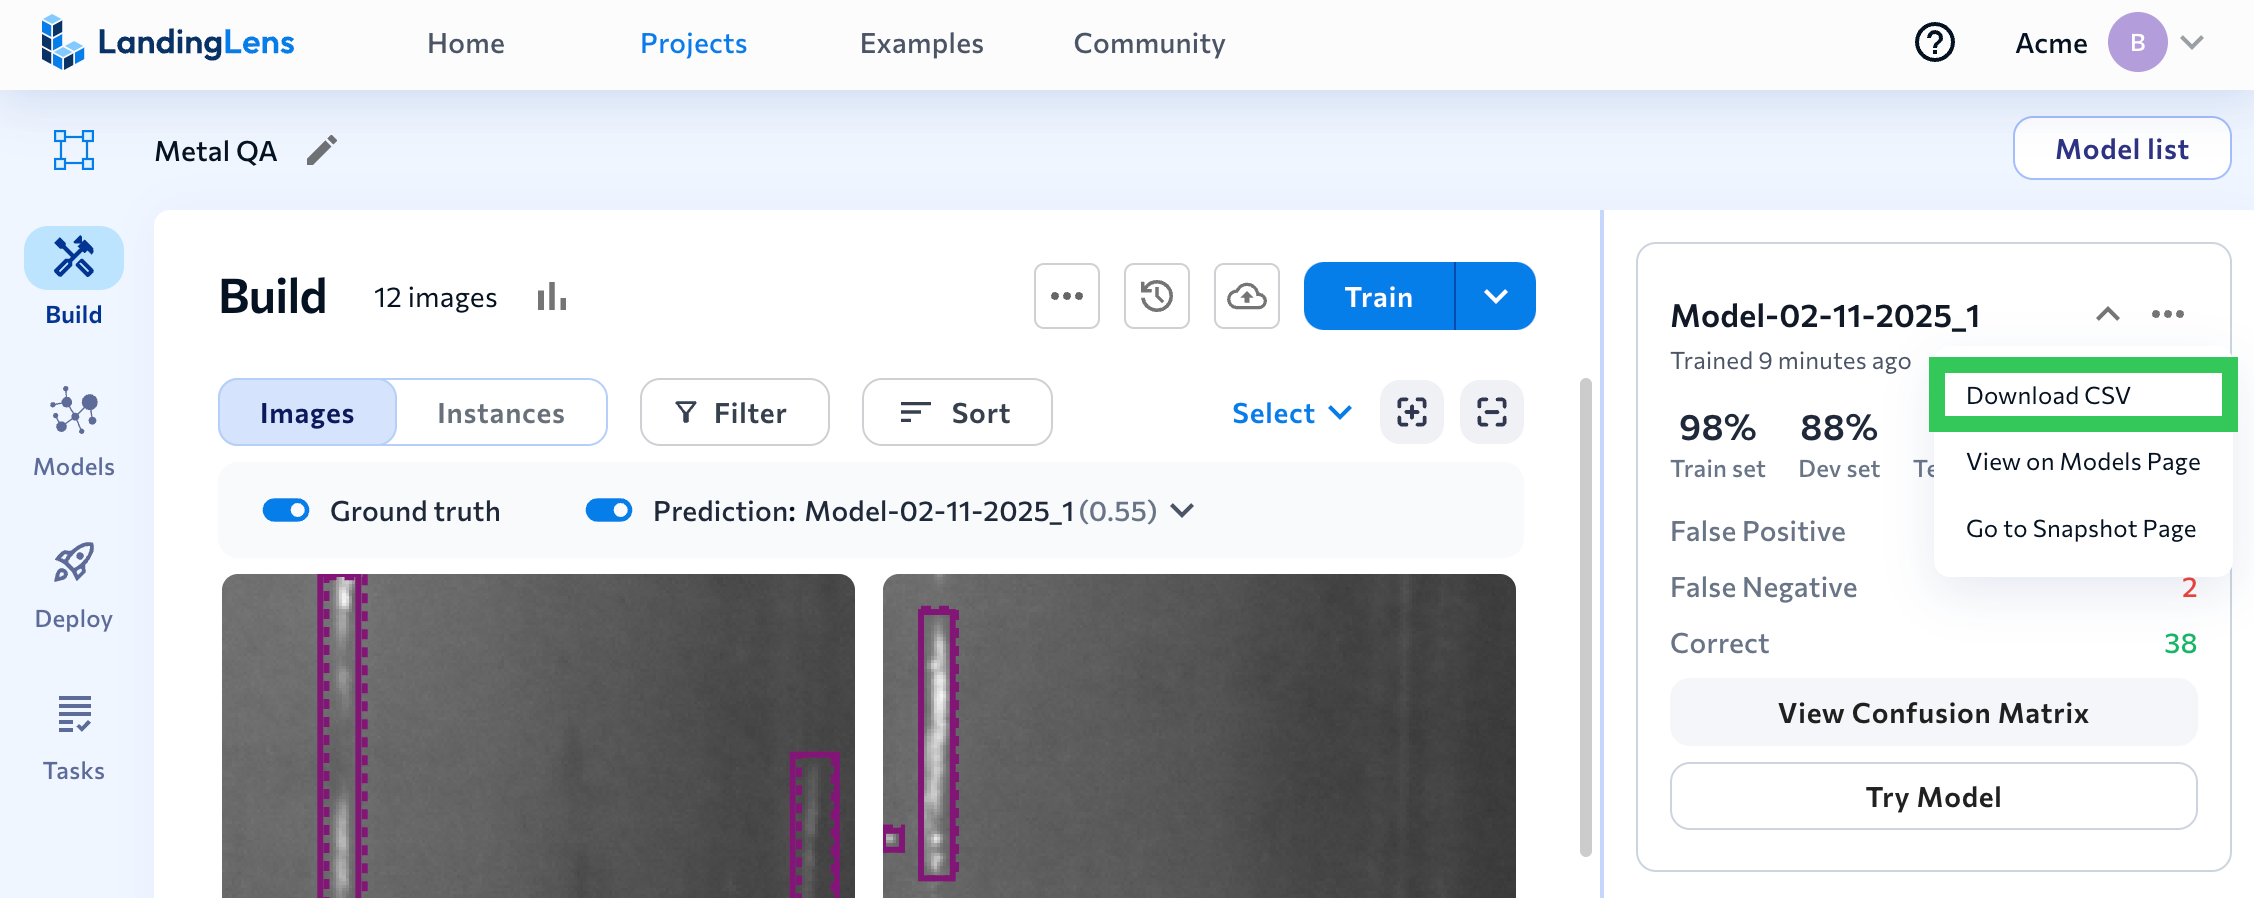
3. Click the **Actions** icon (**...**) on the model tile and click **Download CSV**. (You can also click a model tile to open the model, and then click **Download CSV**).
4. The file is downloaded to your computer. For a description of all data in the file, go to [CSV Data](./model-settings#csv-data).
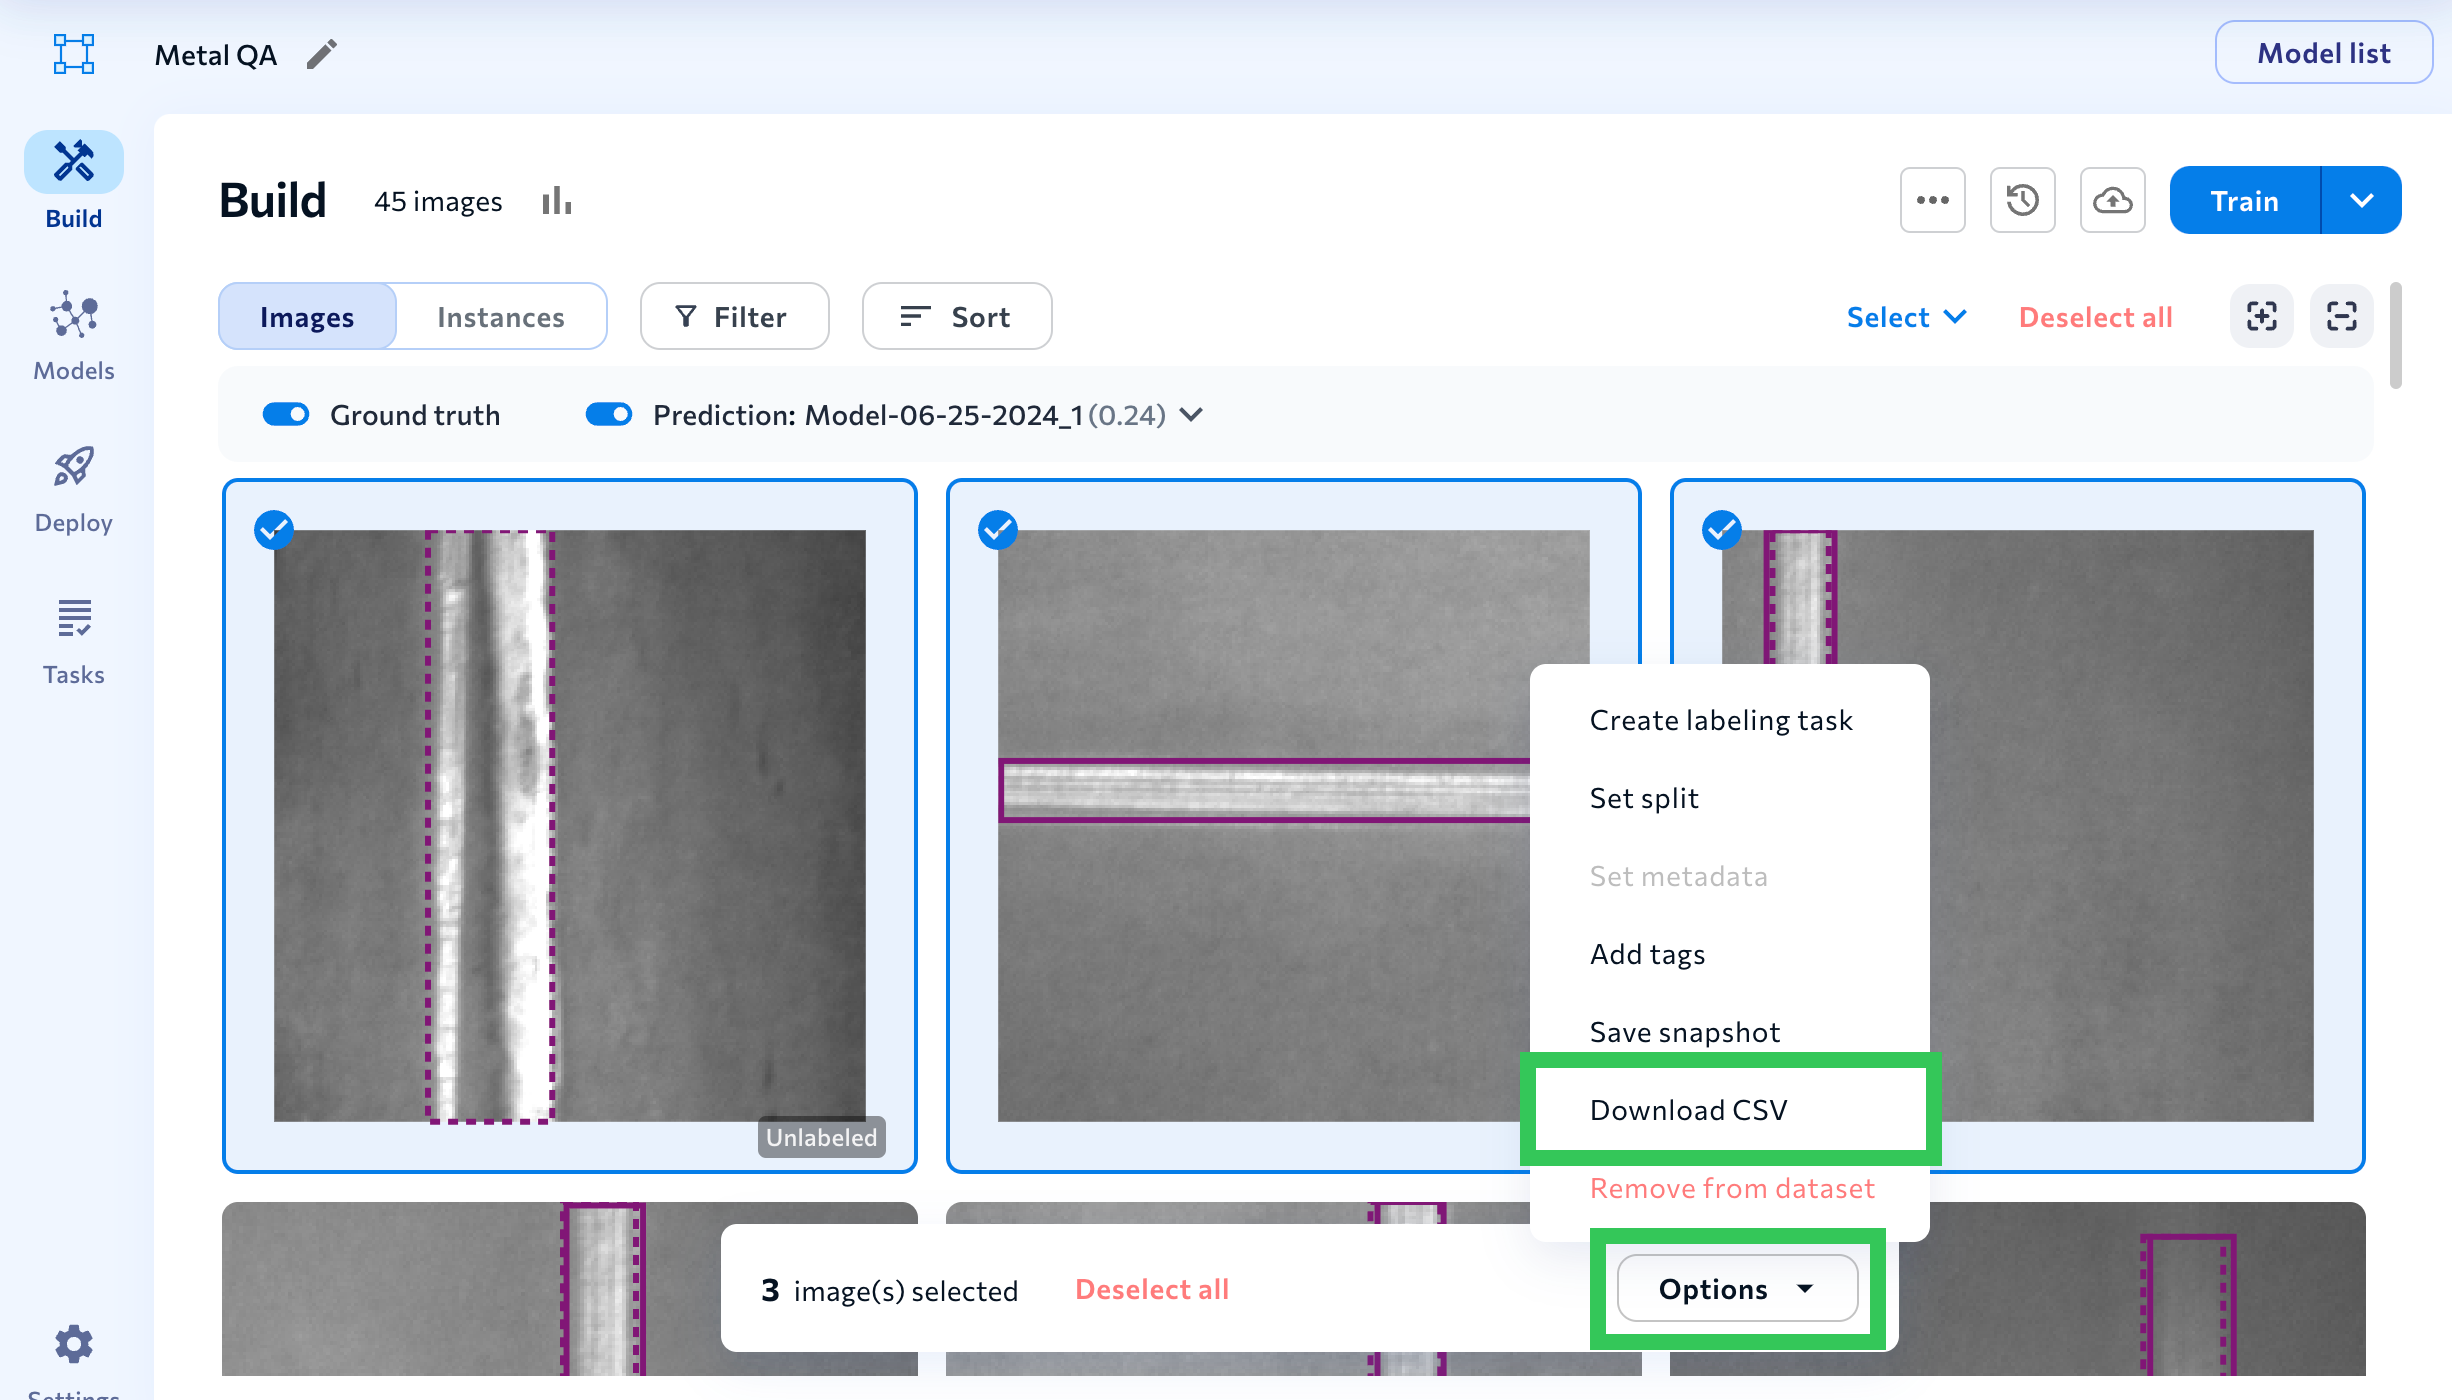
### Download CSV: Model Predictions for Select Images
You can download a CSV of model predictions for select images in your Object Detection or Classification dataset.
The prediction data in the CSV will be based on the selected model and confidence threshold (if you manually change the threshold, that threshold is used in the CSV).
If a model hasn't been created in the project yet, the prediction fields in the CSV will be blank.
To download the CSV for select images in a dataset:
1. Open a project to the **Build** tab.
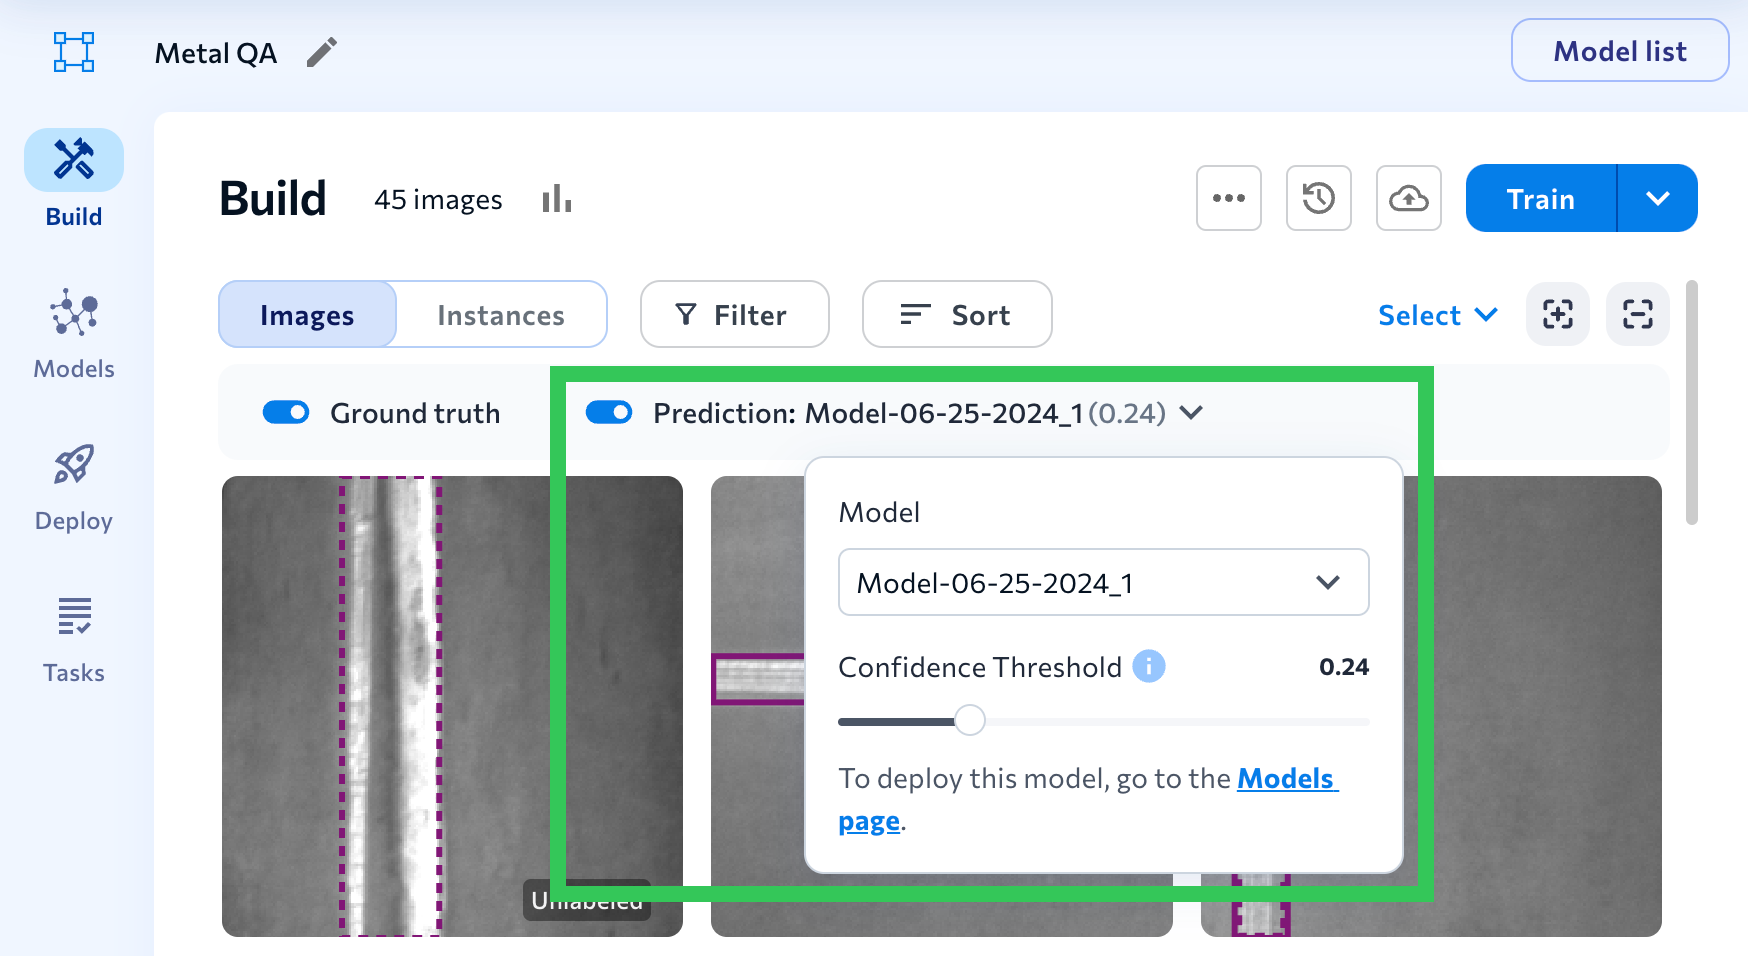
2. Select the model you want to see the predictions for from the **Prediction/Model** drop-down menu.
3. Select the images you want to download the CSV for.
4. Click **Options** in the action bar near the bottom of the screen and select **Download CSV**.
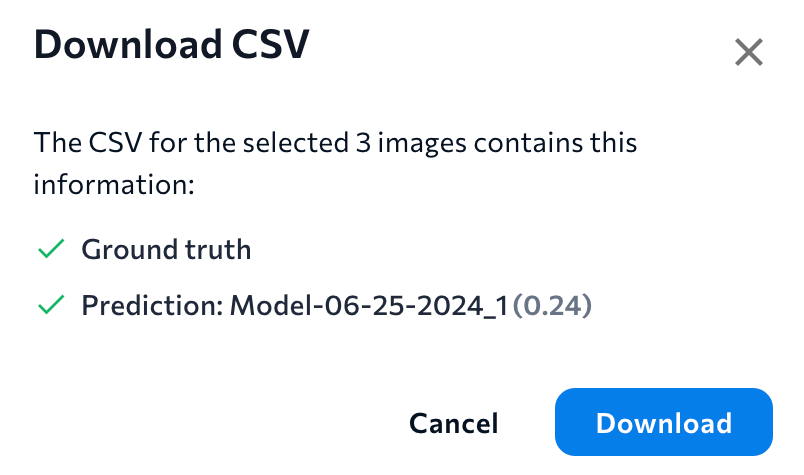
5. Click **Download** on the pop-up window that opens.
6. The file is downloaded to your computer. For a description of all data in the file, go to [CSV Data](./model-settings#csv-data).
### CSV Data
| Item | Description | Example |
| ------------------------------------------ | ------------------------------------------------------------------------------------------------------------------------------------------------------------------------------ | ---------------------------------------------------------------------------------- |
| Project Name | Name of the LandingLens project. | Defect Detection |
| Project Type | Project type ("bounding\_box" is Object Detection). | classification |
| Image Name | The file name of the image uploaded to LandingLens. | sample\_003.jpg |
| Image ID | Unique ID assigned to the image. | 29786892 |
| Split | The split assigned to the image. | train |
| Upload Time | The time the image was uploaded to LandingLens. All times are in Coordinated Universal Time (UTC). | Mon Jun 26 2023 16:37:10 GMT+0000 (Coordinated Universal Time) |
| Image Width | The width (in pixels) of the image when it was uploaded to LandingLens. | 4771 |
| Image Height | The height (in pixels) of the image when it was uploaded to LandingLens. | 2684 |
| Model Name | The name of the model in LandingLens. | 100% Precision and Recall |
| Metadata | Any metadata assigned to the image. If the image doesn't have any metadata, the value is "{}". | `{"Author":"Eric Smith","Organization":"QA"}` |
| GT\_Class | The Classes you assigned to the image (ground truth or “GT”). For Object Detection, this also includes the number of objects you labeled. | `{"Screw":3} ` |
| PRED\_Class | The Classes the model predicted. For Object Detection, this also includes the number of objects predicted. If the model didn't predict any objects, the value is `{"null":1}`. | `{"Screw":2} ` |
| Model\_Correct | If the model's prediction matched the original label (ground truth or “GT”), the value is true. If it didn't match, the value is false. Only for Classification projects. | true |
| PRED\_Class\_Confidence / PRED\_Confidence | The model's Confidence Score for each object predicted. If the model didn't predict any objects, the value is {}. | `[{"Screw":0.94796216},{"Screw":0.9787127}]` |
| Class\_TotalArea | The total area (in pixels) of the model's predicted area. If the model didn't predict any objects, the value is {}. Only for Object Detection projects. | `{"Screw":76060}` |
| GT-PRED JSON | The JSON output comparing the original labels (ground truth or "GT") to the model's predictions. See the JSON Output link for details. | `{"gtDefectName":"No Fire","predDefectName":"No Fire","predConfidence":0.9684047}` |
| THRESHOLD | The confidence threshold for the model applied to the dataset. This column is only included when downloading the CSV for select images. | 0.09 |
## View on Models Page
To adjust the threshold, view visual predictions, or compare the model to other models in the same project, open the model in the [Models tab](./compare-models).
The Model List has a few shortcuts to the Models tab:
* Click the **Actions** icon (**...**) on the model tile and click **View on Models Page**.
* Click **View Confusion Matrix** on a model tile and click **View Full Report**.
* Click **View Confusion Matrix** on a model tile, click the **Actions** icon (**...**) and click **View on Models Page**.
## Go to Snapshot Page
The Model List has a few shortcuts to the [Snapshot page](./dataset-snapshots):
* Click the **Actions** icon (**...**) on the model tile and click **Go to Snapshot Page**.
* Click a model tile, click the **Actions** icon (**...**) and click **Go to Snapshot Page**.
 ## Analyze Model Performance
Watch the following video to learn how to use the model report metrics and confusion matrix to analyze and improve model performance.
## Model List Overview
Here's a quick introduction to the elements of the Model List:
## Analyze Model Performance
Watch the following video to learn how to use the model report metrics and confusion matrix to analyze and improve model performance.
## Model List Overview
Here's a quick introduction to the elements of the Model List:
.png?fit=max&auto=format&n=8jqFf9ryLj15HswR&q=85&s=cba150340aa4bfda3e8c6ab3003801d7) | # | Item | Description |
\| --- | --- | --- |
\| 1 | Model List | Click the **Model List** button to show/hide the model tiles. |
\| 2 | Name | The model name. |
\| 3 | Performance scores for splits | The performance score for each split. Object Detection, Classification, and Anomaly Detection projects show the [F1 score](./model-settings#object-detection-and-classification-f1-score). Segmentation projects show the [Intersection over Union (IoU) score](./model-settings#segmentation-intersection-over-union-iou). |
\| 4 | More Actions | Click the **Actions** icon (**...**) to access these tools or shortcuts: [Download CSV](./model-settings#download-csv-model-performance-for-each-image-in-dataset), [View on Models Page](./model-settings#view-on-models-page), [Go to Snapshot Page](./model-settings#go-to-snapshot-page). |
\| 5 | Predictions | The number of times the model made each of these predictions: False Positive, False Negative, Misclassified, and Correct. (Some predictions aren't applicable to certain project types.)
| # | Item | Description |
\| --- | --- | --- |
\| 1 | Model List | Click the **Model List** button to show/hide the model tiles. |
\| 2 | Name | The model name. |
\| 3 | Performance scores for splits | The performance score for each split. Object Detection, Classification, and Anomaly Detection projects show the [F1 score](./model-settings#object-detection-and-classification-f1-score). Segmentation projects show the [Intersection over Union (IoU) score](./model-settings#segmentation-intersection-over-union-iou). |
\| 4 | More Actions | Click the **Actions** icon (**...**) to access these tools or shortcuts: [Download CSV](./model-settings#download-csv-model-performance-for-each-image-in-dataset), [View on Models Page](./model-settings#view-on-models-page), [Go to Snapshot Page](./model-settings#go-to-snapshot-page). |
\| 5 | Predictions | The number of times the model made each of these predictions: False Positive, False Negative, Misclassified, and Correct. (Some predictions aren't applicable to certain project types.)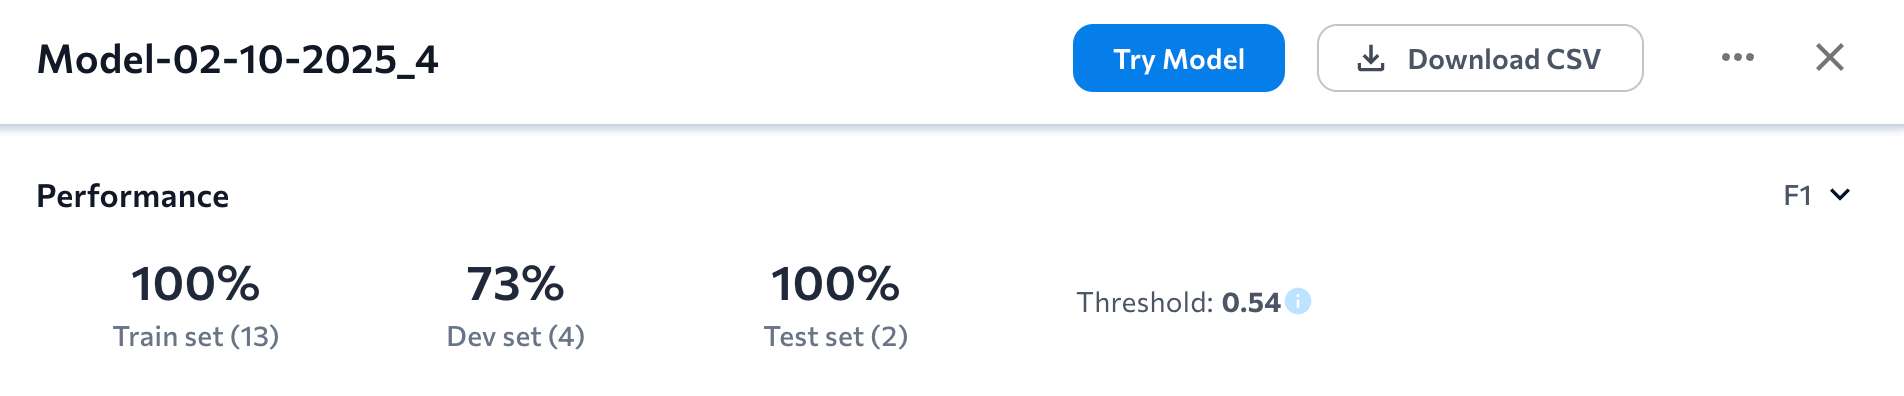 The **Performance** section shows how the model performed on the Train, Dev, and Test sets (see more information about [splits](./splits) here). The number in parentheses is the number of images in the split.
For Object Detection, Segmentation, and Anomaly Detection projects, the scores are based on the confidence threshold that displays. This is the confidence threshold with the best F1 score for all labeled data.
The Performance score unit depends on the project type:
* [Object Detection, Classification, Anomaly Detection: F1 Score](./model-settings#object-detection-classification-anomaly-detection-f1-score)
* [Segmentation: Intersection Over Union (IoU)](./model-settings#segmentation-intersection-over-union-iou)
#### Object Detection, Classification, Anomaly Detection: F1 Score
The Performance section for Object Detection, Classification, and Anomaly Detection projects shows the F1 score for each split.
The **Performance** section shows how the model performed on the Train, Dev, and Test sets (see more information about [splits](./splits) here). The number in parentheses is the number of images in the split.
For Object Detection, Segmentation, and Anomaly Detection projects, the scores are based on the confidence threshold that displays. This is the confidence threshold with the best F1 score for all labeled data.
The Performance score unit depends on the project type:
* [Object Detection, Classification, Anomaly Detection: F1 Score](./model-settings#object-detection-classification-anomaly-detection-f1-score)
* [Segmentation: Intersection Over Union (IoU)](./model-settings#segmentation-intersection-over-union-iou)
#### Object Detection, Classification, Anomaly Detection: F1 Score
The Performance section for Object Detection, Classification, and Anomaly Detection projects shows the F1 score for each split.
 Intersection over Union (IoU) is used to measure the accuracy of the model by measuring the overlap between the predicted and actual masks in an image. A higher IoU indicates better agreement between the ground truth and predicted mask. LandingLens does not include the implicit background and micro-averaging in the calculation of the IoU.
#### Precision
Select **Precision** from the drop-down in the **Performance** section to see the Precision scores for each split.
Intersection over Union (IoU) is used to measure the accuracy of the model by measuring the overlap between the predicted and actual masks in an image. A higher IoU indicates better agreement between the ground truth and predicted mask. LandingLens does not include the implicit background and micro-averaging in the calculation of the IoU.
#### Precision
Select **Precision** from the drop-down in the **Performance** section to see the Precision scores for each split.
 **Precision** is the model’s ability to be accurate when it says something is true. Precision answers the natural language question, “When the model makes a prediction, how often is it correct?” This metric shows how accurate the model predictions are. The higher the Precision score, the more accurate the predictions are.
For **Object Detection** and **Segmentation**, Precision is calculated using this algorithm:
$$
Precision = \frac{TruePositives}{TruePositives + FalsePositives}
$$
For **Classification** and **Anomaly Detection**, the F1, Precision, and Recall scores are identical. This is because these models have only two prediction outcomes: "Correct" and "Misclassified". Therefore, the F1, Precision, and Recall scores for these models are all calculated using this algorithm:
$$
\frac{Corrects}{Misclassifieds}
$$
#### Recall
Select **Recall** from the drop-down in the **Performance** section to see the Recall scores for each split.
**Precision** is the model’s ability to be accurate when it says something is true. Precision answers the natural language question, “When the model makes a prediction, how often is it correct?” This metric shows how accurate the model predictions are. The higher the Precision score, the more accurate the predictions are.
For **Object Detection** and **Segmentation**, Precision is calculated using this algorithm:
$$
Precision = \frac{TruePositives}{TruePositives + FalsePositives}
$$
For **Classification** and **Anomaly Detection**, the F1, Precision, and Recall scores are identical. This is because these models have only two prediction outcomes: "Correct" and "Misclassified". Therefore, the F1, Precision, and Recall scores for these models are all calculated using this algorithm:
$$
\frac{Corrects}{Misclassifieds}
$$
#### Recall
Select **Recall** from the drop-down in the **Performance** section to see the Recall scores for each split.
 **Recall** is the model’s ability to find all objects of interest. Recall answers the natural language question, “Of all the labels (ground truths) in the dataset, what percent of them are found by the model?” It conveys how accurately the model can correctly identify all the actual positive instances in the dataset. The higher the Recall score, the lower the chance the model will have a false negative.
For **Object Detection** and **Segmentation**, Recall is calculated using this algorithm:
$$
Recall = \frac{TruePositives}{TruePositives + FalseNegatives}
$$
For **Classification** and **Anomaly Detection**, the F1, Precision, and Recall scores are identical. This is because these models have only two prediction outcomes: "Correct" and "Misclassified". Therefore, the F1, Precision, and Recall scores for these models are all calculated using this algorithm:
$$
\frac{Corrects}{Misclassifieds}
$$
### Confusion Matrix
Click **View Confusion Matrix** on a model tile to see the confusion matrix.
**Recall** is the model’s ability to find all objects of interest. Recall answers the natural language question, “Of all the labels (ground truths) in the dataset, what percent of them are found by the model?” It conveys how accurately the model can correctly identify all the actual positive instances in the dataset. The higher the Recall score, the lower the chance the model will have a false negative.
For **Object Detection** and **Segmentation**, Recall is calculated using this algorithm:
$$
Recall = \frac{TruePositives}{TruePositives + FalseNegatives}
$$
For **Classification** and **Anomaly Detection**, the F1, Precision, and Recall scores are identical. This is because these models have only two prediction outcomes: "Correct" and "Misclassified". Therefore, the F1, Precision, and Recall scores for these models are all calculated using this algorithm:
$$
\frac{Corrects}{Misclassifieds}
$$
### Confusion Matrix
Click **View Confusion Matrix** on a model tile to see the confusion matrix.
 The confusion matrix counts ground truth labels versus model predictions. The confusion matrix shown here is for the *dataset that the model was trained on*.
The y-axis represents each ground truth label. The x-axis represents each possible model prediction.
Each cell shows the count of instances that correspond to a particular ground truth class-predicted class pair. For example, in the image below, the model correctly predicted the class "Hard Hat" 32 times and misclassified it 2 times.
The confusion matrix counts ground truth labels versus model predictions. The confusion matrix shown here is for the *dataset that the model was trained on*.
The y-axis represents each ground truth label. The x-axis represents each possible model prediction.
Each cell shows the count of instances that correspond to a particular ground truth class-predicted class pair. For example, in the image below, the model correctly predicted the class "Hard Hat" 32 times and misclassified it 2 times.
 ### Precision Score for Class
The Precision score for each class is listed along the x-axis. Precision answers the natural language question, “When the model predicts Class A, how often is it correct?”
The Precision score for a class is the percentage of instances that the model correctly predicted the class out of all instances that the model predicted the class, and is calculated using this equation:
$$
Precision_A = \frac{TruePositives_A}{TruePositives_A + FalsePositives_A}
$$
For example, let’s calculate the Precision score for the Wheat class in the image below. The model predicts Wheat 7 times. Of those, 6 are correct (True Positives) and 1 is incorrect (False Positives). When we plug those numbers into the Precision equation, we see that the Precision for this class is 85.7%.
$$
= \displaystyle\frac{6}{6 + 1}
$$
$$
= 85.7\%
$$
### Precision Score for Class
The Precision score for each class is listed along the x-axis. Precision answers the natural language question, “When the model predicts Class A, how often is it correct?”
The Precision score for a class is the percentage of instances that the model correctly predicted the class out of all instances that the model predicted the class, and is calculated using this equation:
$$
Precision_A = \frac{TruePositives_A}{TruePositives_A + FalsePositives_A}
$$
For example, let’s calculate the Precision score for the Wheat class in the image below. The model predicts Wheat 7 times. Of those, 6 are correct (True Positives) and 1 is incorrect (False Positives). When we plug those numbers into the Precision equation, we see that the Precision for this class is 85.7%.
$$
= \displaystyle\frac{6}{6 + 1}
$$
$$
= 85.7\%
$$
 ### Recall Score for Class
The Recall score for each class is listed along the y-axis. Recall answers the natural language question, “Of all the Class As in the dataset, what percent of them are found by the model?”
The Recall score for a class is the percentage of instances that the model correctly predicted the class out of all actual instances of the class, and is calculated using this equation:
$$
Recall_A = \frac{TruePositives_A}{TruePositives_A + FalseNegatives_A}
$$
For example, let’s calculate the Recall score for the Wheat class in the image below. The dataset has 8 instances of Wheat. The model predicts 6 instances correctly (True Positives) and 2 instances incorrectly (False Negatives). When we plug those numbers into the Recall equation, we see that the Recall for this class is 75.0%.
$$
= \displaystyle\frac{6}{6 + 2}
$$
$$
= 75.0\%
$$
### Recall Score for Class
The Recall score for each class is listed along the y-axis. Recall answers the natural language question, “Of all the Class As in the dataset, what percent of them are found by the model?”
The Recall score for a class is the percentage of instances that the model correctly predicted the class out of all actual instances of the class, and is calculated using this equation:
$$
Recall_A = \frac{TruePositives_A}{TruePositives_A + FalseNegatives_A}
$$
For example, let’s calculate the Recall score for the Wheat class in the image below. The dataset has 8 instances of Wheat. The model predicts 6 instances correctly (True Positives) and 2 instances incorrectly (False Negatives). When we plug those numbers into the Recall equation, we see that the Recall for this class is 75.0%.
$$
= \displaystyle\frac{6}{6 + 2}
$$
$$
= 75.0\%
$$
 ### Use Colors to Help Interpret Performance
Each cell has a color that can quickly help you identify correct classifications and errors. Darker colors indicate a higher number, and lighter colors indicate a lower number.
For example, if the model correctly predicts all instances, only the cells on the diagonal will be blue and have non-zero values. See the following image as an example.
### Use Colors to Help Interpret Performance
Each cell has a color that can quickly help you identify correct classifications and errors. Darker colors indicate a higher number, and lighter colors indicate a lower number.
For example, if the model correctly predicts all instances, only the cells on the diagonal will be blue and have non-zero values. See the following image as an example.
 If any off-diagonal cells contain values, start by looking for the darker colors to understand where the model is making errors. For example, let’s say you want to evaluate performance for the Rice class using the confusion matrix below. The model correctly predicted 1 instance and misclassified 3 instances. Consider looking at the instances that were misclassified as Corn first, since that cell is darker (and has a higher number) than the Wheat cell.
 ## Try Model
After you train a model, you can test its performance by using the **Try Model** tool. Using Try Model is a good way to "spot-check" a model's performance.
When you click **Try Model**, you can upload a few images to see how the model performs on them. Ideally, you should upload images that aren't already in the dataset and that match your real-world use case. If the model performs well on the new images, you can [deploy it](./deployment-options). If the model doesn't perform well on the images, try uploading and labeling more images in your project. Then run Try Model again.
The Try Model tool runs inference on each image, so using this tool costs 1 credit per image. (The credit cost is not applicable when using {llsf}.)
To use **Try Model**:
1. Open a project to the **Build** tab.
2. Click **Model List** to view all models in the project.
3. Click **Try Model** on the model you want to use. (You can also click a model tile to open the model, and then click **Try Model**.)
## Try Model
After you train a model, you can test its performance by using the **Try Model** tool. Using Try Model is a good way to "spot-check" a model's performance.
When you click **Try Model**, you can upload a few images to see how the model performs on them. Ideally, you should upload images that aren't already in the dataset and that match your real-world use case. If the model performs well on the new images, you can [deploy it](./deployment-options). If the model doesn't perform well on the images, try uploading and labeling more images in your project. Then run Try Model again.
The Try Model tool runs inference on each image, so using this tool costs 1 credit per image. (The credit cost is not applicable when using {llsf}.)
To use **Try Model**:
1. Open a project to the **Build** tab.
2. Click **Model List** to view all models in the project.
3. Click **Try Model** on the model you want to use. (You can also click a model tile to open the model, and then click **Try Model**.)
 4. Upload images.
 5. LandingLens runs the model and shows you the results. Adjust the **Confidence Threshold** slider (for Object Detection and Segmentation) or **Anomaly Threshold** slider (for Anomaly Detection) to see how the model performs with different thresholds. Typically, a lower threshold means that you will see more predictions, while a higher threshold means you will see fewer.
 ## Download CSV of Model Predictions
For Object Detection and Classification projects, you can download a CSV that shows the ground truth labels and model predictions for images. You can download the CSV:
* [For images in a model dataset](./model-settings#download-csv-model-predictions-for-images-in-a-model-dataset)
* [For select images](./model-settings#download-csv-model-predictions-for-select-images)
### Download CSV: Model Predictions for Images in a Model Dataset
You can download a CSV of model predictions for the dataset of images that a model was trained on. This is available for Object Detection and Classification projects.
The prediction data in the CSV will be based on the selected model and its default confidence threshold.
To download the CSV for images in a model's dataset:
1. Open a project to the **Build** tab.
2. Click **Model List** to view all models in the project.
3. Click the **Actions** icon (**...**) on the model tile and click **Download CSV**. (You can also click a model tile to open the model, and then click **Download CSV**).
## Download CSV of Model Predictions
For Object Detection and Classification projects, you can download a CSV that shows the ground truth labels and model predictions for images. You can download the CSV:
* [For images in a model dataset](./model-settings#download-csv-model-predictions-for-images-in-a-model-dataset)
* [For select images](./model-settings#download-csv-model-predictions-for-select-images)
### Download CSV: Model Predictions for Images in a Model Dataset
You can download a CSV of model predictions for the dataset of images that a model was trained on. This is available for Object Detection and Classification projects.
The prediction data in the CSV will be based on the selected model and its default confidence threshold.
To download the CSV for images in a model's dataset:
1. Open a project to the **Build** tab.
2. Click **Model List** to view all models in the project.
3. Click the **Actions** icon (**...**) on the model tile and click **Download CSV**. (You can also click a model tile to open the model, and then click **Download CSV**).
 4. The file is downloaded to your computer. For a description of all data in the file, go to [CSV Data](./model-settings#csv-data).
### Download CSV: Model Predictions for Select Images
You can download a CSV of model predictions for select images in your Object Detection or Classification dataset.
The prediction data in the CSV will be based on the selected model and confidence threshold (if you manually change the threshold, that threshold is used in the CSV).
If a model hasn't been created in the project yet, the prediction fields in the CSV will be blank.
To download the CSV for select images in a dataset:
1. Open a project to the **Build** tab.
2. Select the model you want to see the predictions for from the **Prediction/Model** drop-down menu.
4. The file is downloaded to your computer. For a description of all data in the file, go to [CSV Data](./model-settings#csv-data).
### Download CSV: Model Predictions for Select Images
You can download a CSV of model predictions for select images in your Object Detection or Classification dataset.
The prediction data in the CSV will be based on the selected model and confidence threshold (if you manually change the threshold, that threshold is used in the CSV).
If a model hasn't been created in the project yet, the prediction fields in the CSV will be blank.
To download the CSV for select images in a dataset:
1. Open a project to the **Build** tab.
2. Select the model you want to see the predictions for from the **Prediction/Model** drop-down menu.
 3. Select the images you want to download the CSV for.
4. Click **Options** in the action bar near the bottom of the screen and select **Download CSV**.
3. Select the images you want to download the CSV for.
4. Click **Options** in the action bar near the bottom of the screen and select **Download CSV**.
 5. Click **Download** on the pop-up window that opens.
 6. The file is downloaded to your computer. For a description of all data in the file, go to [CSV Data](./model-settings#csv-data).
### CSV Data
| Item | Description | Example |
| ------------------------------------------ | ------------------------------------------------------------------------------------------------------------------------------------------------------------------------------ | ---------------------------------------------------------------------------------- |
| Project Name | Name of the LandingLens project. | Defect Detection |
| Project Type | Project type ("bounding\_box" is Object Detection). | classification |
| Image Name | The file name of the image uploaded to LandingLens. | sample\_003.jpg |
| Image ID | Unique ID assigned to the image. | 29786892 |
| Split | The split assigned to the image. | train |
| Upload Time | The time the image was uploaded to LandingLens. All times are in Coordinated Universal Time (UTC). | Mon Jun 26 2023 16:37:10 GMT+0000 (Coordinated Universal Time) |
| Image Width | The width (in pixels) of the image when it was uploaded to LandingLens. | 4771 |
| Image Height | The height (in pixels) of the image when it was uploaded to LandingLens. | 2684 |
| Model Name | The name of the model in LandingLens. | 100% Precision and Recall |
| Metadata | Any metadata assigned to the image. If the image doesn't have any metadata, the value is "{}". | `{"Author":"Eric Smith","Organization":"QA"}` |
| GT\_Class | The Classes you assigned to the image (ground truth or “GT”). For Object Detection, this also includes the number of objects you labeled. | `{"Screw":3} ` |
| PRED\_Class | The Classes the model predicted. For Object Detection, this also includes the number of objects predicted. If the model didn't predict any objects, the value is `{"null":1}`. | `{"Screw":2} ` |
| Model\_Correct | If the model's prediction matched the original label (ground truth or “GT”), the value is true. If it didn't match, the value is false. Only for Classification projects. | true |
| PRED\_Class\_Confidence / PRED\_Confidence | The model's Confidence Score for each object predicted. If the model didn't predict any objects, the value is {}. | `[{"Screw":0.94796216},{"Screw":0.9787127}]` |
| Class\_TotalArea | The total area (in pixels) of the model's predicted area. If the model didn't predict any objects, the value is {}. Only for Object Detection projects. | `{"Screw":76060}` |
| GT-PRED JSON | The JSON output comparing the original labels (ground truth or "GT") to the model's predictions. See the JSON Output link for details. | `{"gtDefectName":"No Fire","predDefectName":"No Fire","predConfidence":0.9684047}` |
| THRESHOLD | The confidence threshold for the model applied to the dataset. This column is only included when downloading the CSV for select images. | 0.09 |
## View on Models Page
To adjust the threshold, view visual predictions, or compare the model to other models in the same project, open the model in the [Models tab](./compare-models).
The Model List has a few shortcuts to the Models tab:
* Click the **Actions** icon (**...**) on the model tile and click **View on Models Page**.
* Click **View Confusion Matrix** on a model tile and click **View Full Report**.
* Click **View Confusion Matrix** on a model tile, click the **Actions** icon (**...**) and click **View on Models Page**.
## Go to Snapshot Page
The Model List has a few shortcuts to the [Snapshot page](./dataset-snapshots):
* Click the **Actions** icon (**...**) on the model tile and click **Go to Snapshot Page**.
* Click a model tile, click the **Actions** icon (**...**) and click **Go to Snapshot Page**.
6. The file is downloaded to your computer. For a description of all data in the file, go to [CSV Data](./model-settings#csv-data).
### CSV Data
| Item | Description | Example |
| ------------------------------------------ | ------------------------------------------------------------------------------------------------------------------------------------------------------------------------------ | ---------------------------------------------------------------------------------- |
| Project Name | Name of the LandingLens project. | Defect Detection |
| Project Type | Project type ("bounding\_box" is Object Detection). | classification |
| Image Name | The file name of the image uploaded to LandingLens. | sample\_003.jpg |
| Image ID | Unique ID assigned to the image. | 29786892 |
| Split | The split assigned to the image. | train |
| Upload Time | The time the image was uploaded to LandingLens. All times are in Coordinated Universal Time (UTC). | Mon Jun 26 2023 16:37:10 GMT+0000 (Coordinated Universal Time) |
| Image Width | The width (in pixels) of the image when it was uploaded to LandingLens. | 4771 |
| Image Height | The height (in pixels) of the image when it was uploaded to LandingLens. | 2684 |
| Model Name | The name of the model in LandingLens. | 100% Precision and Recall |
| Metadata | Any metadata assigned to the image. If the image doesn't have any metadata, the value is "{}". | `{"Author":"Eric Smith","Organization":"QA"}` |
| GT\_Class | The Classes you assigned to the image (ground truth or “GT”). For Object Detection, this also includes the number of objects you labeled. | `{"Screw":3} ` |
| PRED\_Class | The Classes the model predicted. For Object Detection, this also includes the number of objects predicted. If the model didn't predict any objects, the value is `{"null":1}`. | `{"Screw":2} ` |
| Model\_Correct | If the model's prediction matched the original label (ground truth or “GT”), the value is true. If it didn't match, the value is false. Only for Classification projects. | true |
| PRED\_Class\_Confidence / PRED\_Confidence | The model's Confidence Score for each object predicted. If the model didn't predict any objects, the value is {}. | `[{"Screw":0.94796216},{"Screw":0.9787127}]` |
| Class\_TotalArea | The total area (in pixels) of the model's predicted area. If the model didn't predict any objects, the value is {}. Only for Object Detection projects. | `{"Screw":76060}` |
| GT-PRED JSON | The JSON output comparing the original labels (ground truth or "GT") to the model's predictions. See the JSON Output link for details. | `{"gtDefectName":"No Fire","predDefectName":"No Fire","predConfidence":0.9684047}` |
| THRESHOLD | The confidence threshold for the model applied to the dataset. This column is only included when downloading the CSV for select images. | 0.09 |
## View on Models Page
To adjust the threshold, view visual predictions, or compare the model to other models in the same project, open the model in the [Models tab](./compare-models).
The Model List has a few shortcuts to the Models tab:
* Click the **Actions** icon (**...**) on the model tile and click **View on Models Page**.
* Click **View Confusion Matrix** on a model tile and click **View Full Report**.
* Click **View Confusion Matrix** on a model tile, click the **Actions** icon (**...**) and click **View on Models Page**.
## Go to Snapshot Page
The Model List has a few shortcuts to the [Snapshot page](./dataset-snapshots):
* Click the **Actions** icon (**...**) on the model tile and click **Go to Snapshot Page**.
* Click a model tile, click the **Actions** icon (**...**) and click **Go to Snapshot Page**.