> ## Documentation Index
> Fetch the complete documentation index at: https://landinglens.docs.landing.ai/llms.txt
> Use this file to discover all available pages before exploring further.
# Compare Models
export const vp = 'Visual Prompting';
export const smartLabel = 'Smart Labeling';
export const productLL = 'LandingLens';
export const mi = 'Mobile Inference';
export const llsf = 'LandingLens on Snowflake';
export const companyName = 'LandingAI';
*This article applies to these versions of LandingLens:*
| LandingLens |
LandingLens on Snowflake |
| ✓ |
✓ |
The Models page is a great way to get a high-level view of how different models performed on multiple datasets at once. However, if you'd like to see more details about how two specific models compare, use the **Compare Models** tool. The Compare Models tool is a great way to evaluate performance on multiple iterations of the model. It can help you identify if you need to improve your labels, datasets, and hyperparameters.
When you run the Compare Models tool, you set a **baseline** model and a **candidate** model. LandingLens then shows you if the candidate model performed better or worse across several metrics. You can even see a side-by-side comparison of how the baseline and candidate models performed on each image in the dataset.
 Comparisons are generated on-demand, and are not saved.
## Run the Compare Models Tool
To compare two models:
1. Open the project to the **Models** tab.
2. Hover over the cell for one of the models you want to compare and click the **Compare** icon that appears. This model will be the *baseline* in the comparison. In other words, the second model will be compared as either better or worse than this model.
3. Click the cell for the second model you want to compare. This model will be the \*candidate \*in the comparison. In other words, this model will be compared as either better or worse than the first model.
Want to switch the baseline and candidate models? Click the **Switch** icon.
4. Click **Compare**.
Comparisons are generated on-demand, and are not saved.
## Run the Compare Models Tool
To compare two models:
1. Open the project to the **Models** tab.
2. Hover over the cell for one of the models you want to compare and click the **Compare** icon that appears. This model will be the *baseline* in the comparison. In other words, the second model will be compared as either better or worse than this model.
3. Click the cell for the second model you want to compare. This model will be the \*candidate \*in the comparison. In other words, this model will be compared as either better or worse than the first model.
Want to switch the baseline and candidate models? Click the **Switch** icon.
4. Click **Compare**.
.gif?s=ba314a5dd3dc2f4d350c44dd442d730c) 5. The Compare Models window opens and shows the difference in performance between the two models.
5. The Compare Models window opens and shows the difference in performance between the two models.
 ## Model Performance Scores
The top of the Compare Models window shows how each model performed on the *evaluation set*. It also shows the difference in score between the two models. For example, in the image below, The F1 score for the candidate model is 2.8% higher than the F1 score for the baseline model (92.3 - 89.5 = 2.8).
These performance scores are included:
* F1 (for Object Detection, Classification, and Anomaly Detection)
* IoU (for Segmentation)
* Precision
* Recall
## Model Performance Scores
The top of the Compare Models window shows how each model performed on the *evaluation set*. It also shows the difference in score between the two models. For example, in the image below, The F1 score for the candidate model is 2.8% higher than the F1 score for the baseline model (92.3 - 89.5 = 2.8).
These performance scores are included:
* F1 (for Object Detection, Classification, and Anomaly Detection)
* IoU (for Segmentation)
* Precision
* Recall
.png?fit=max&auto=format&n=hjeGEKEYbDsj6EG_&q=85&s=70a425509f635eb4c38507c768ca0c15) ## Compare Training Settings
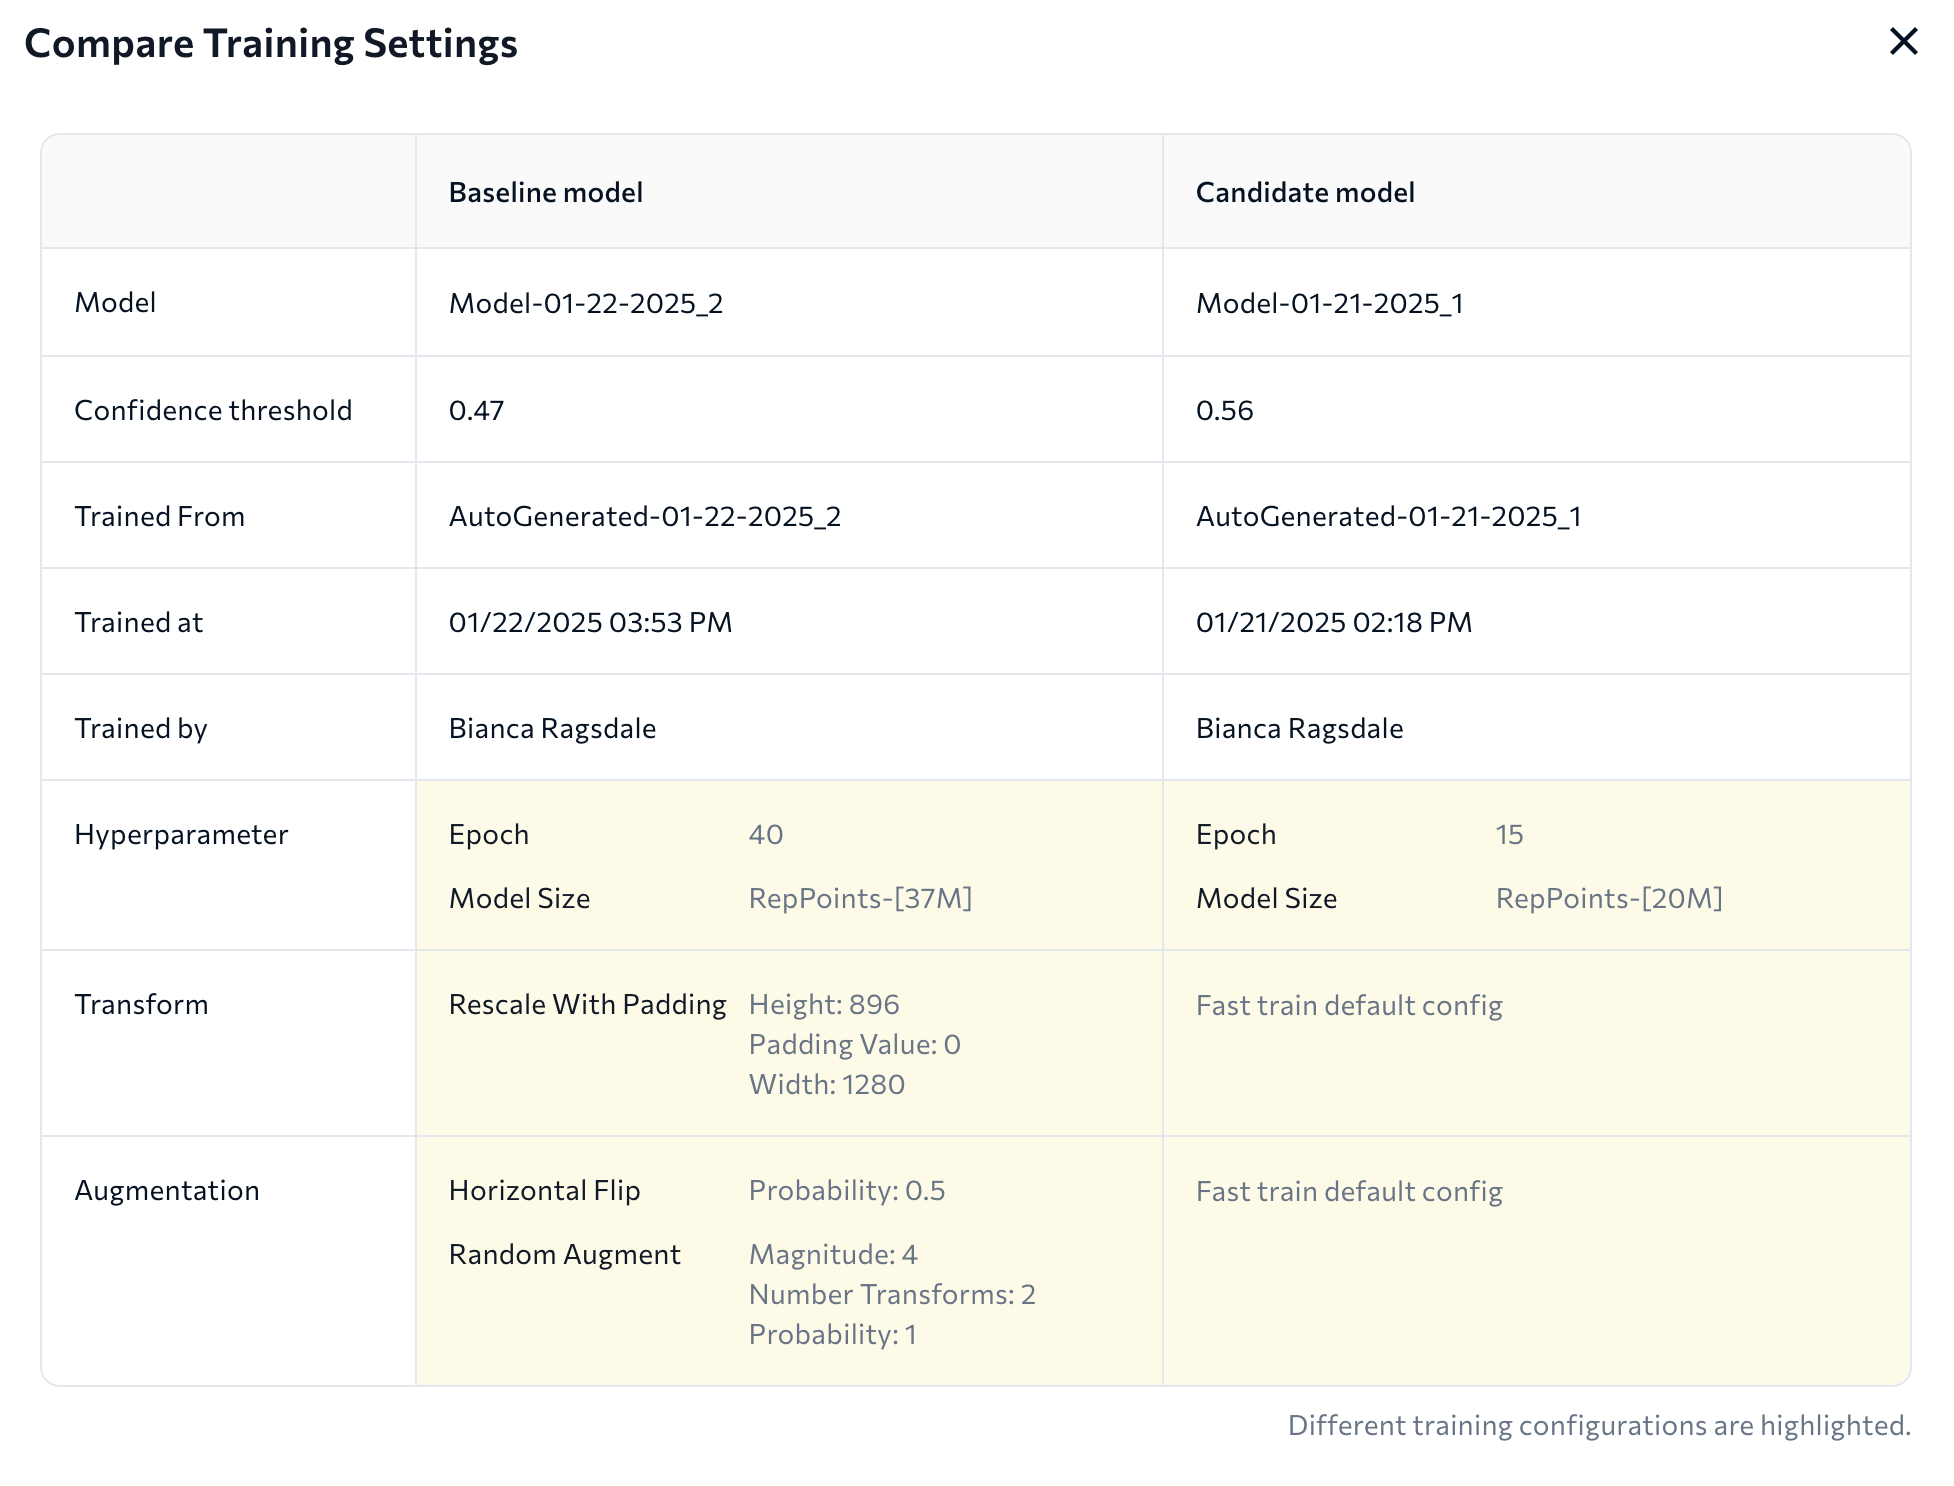
To see the model training information for each model, click **Compare Training Settings**.
## Compare Training Settings
To see the model training information for each model, click **Compare Training Settings**.
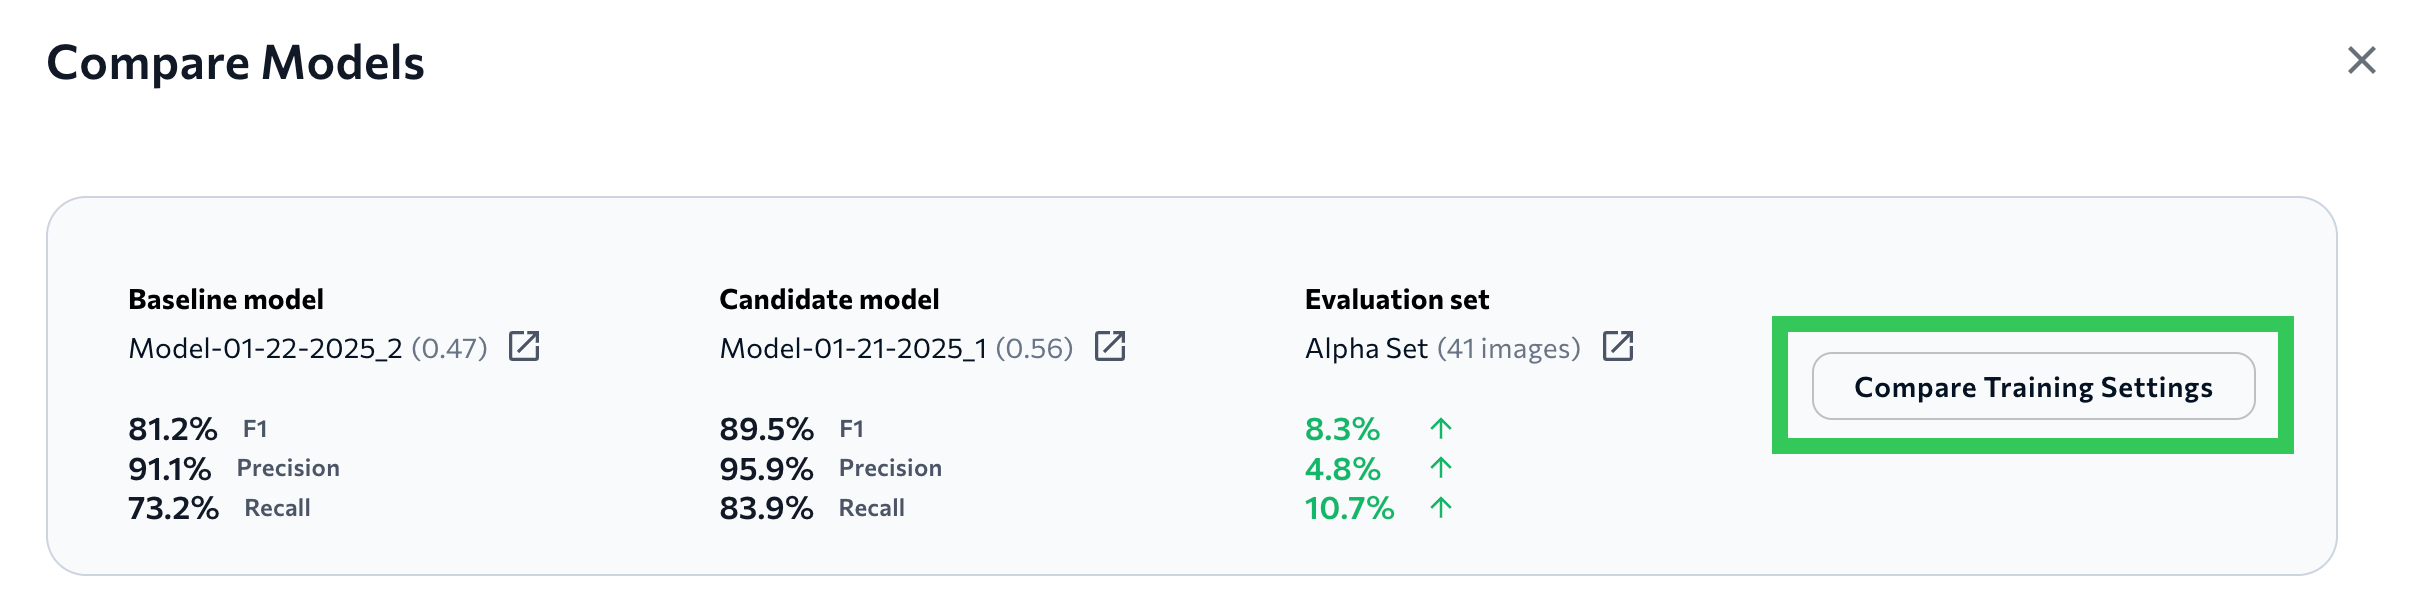 This opens a table with a side-by-side comparison of the settings used to train each models. Differences in training settings are highlighted.
 ## Confusion Matrices
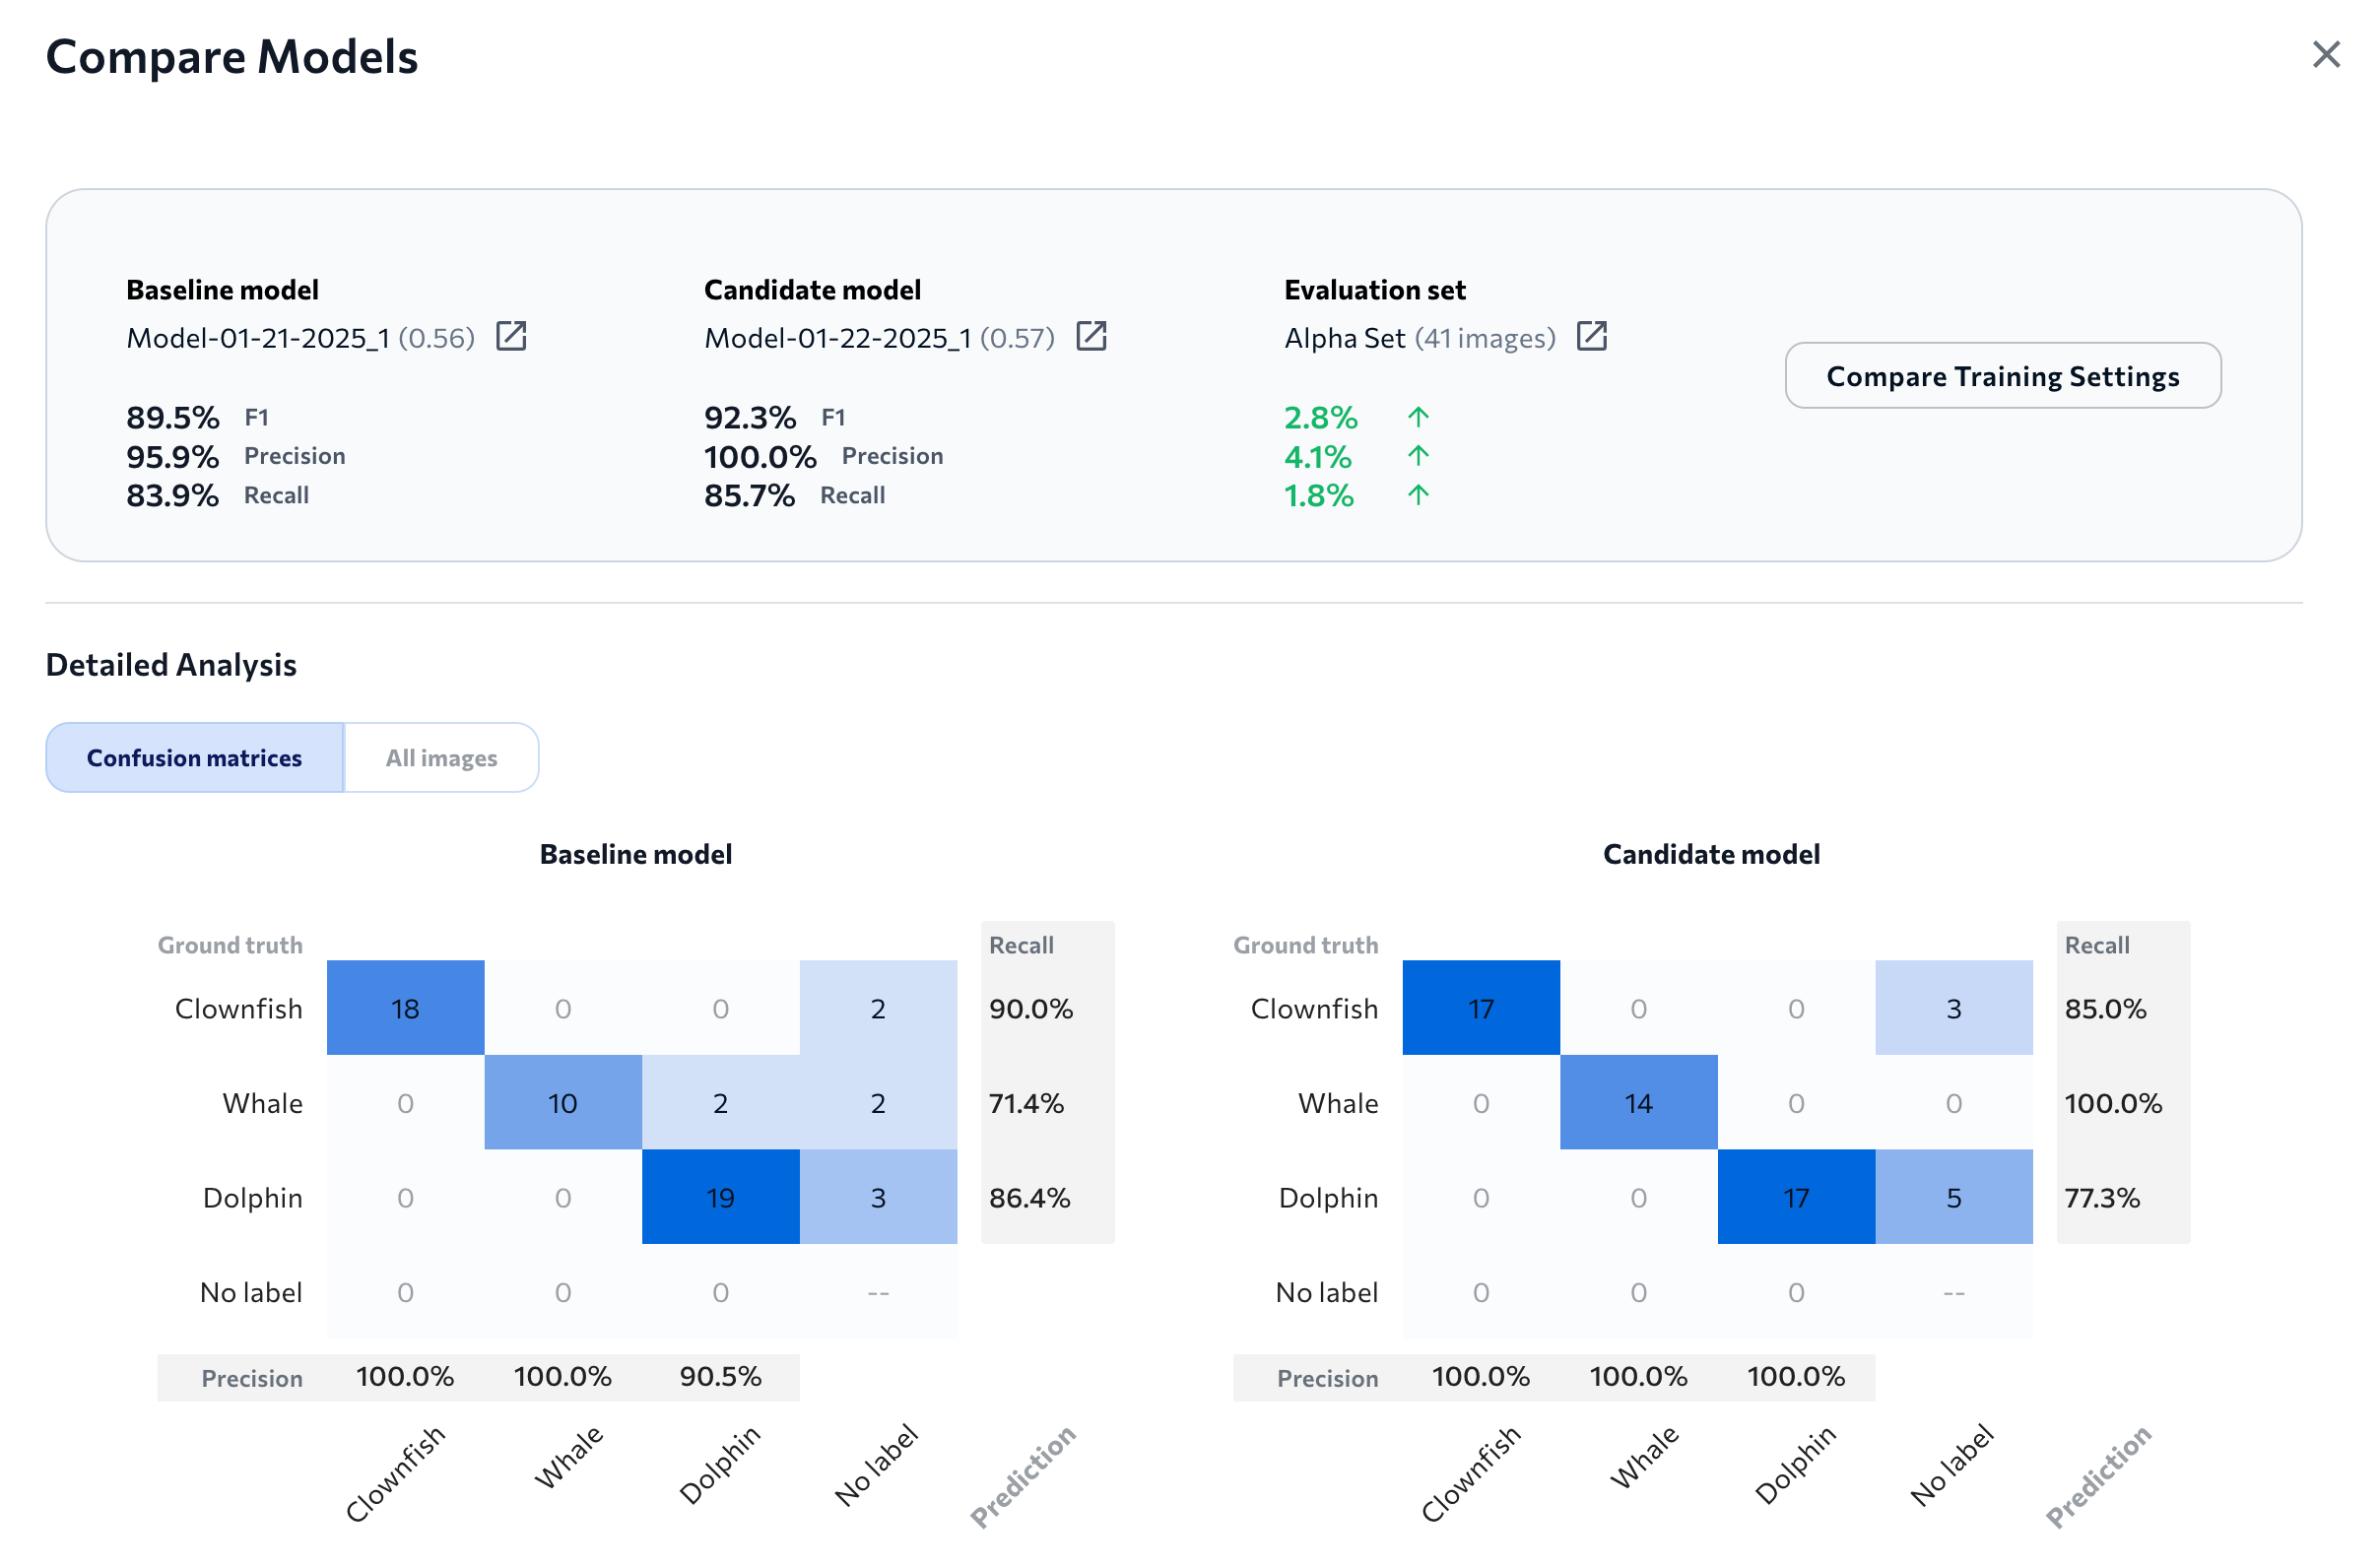
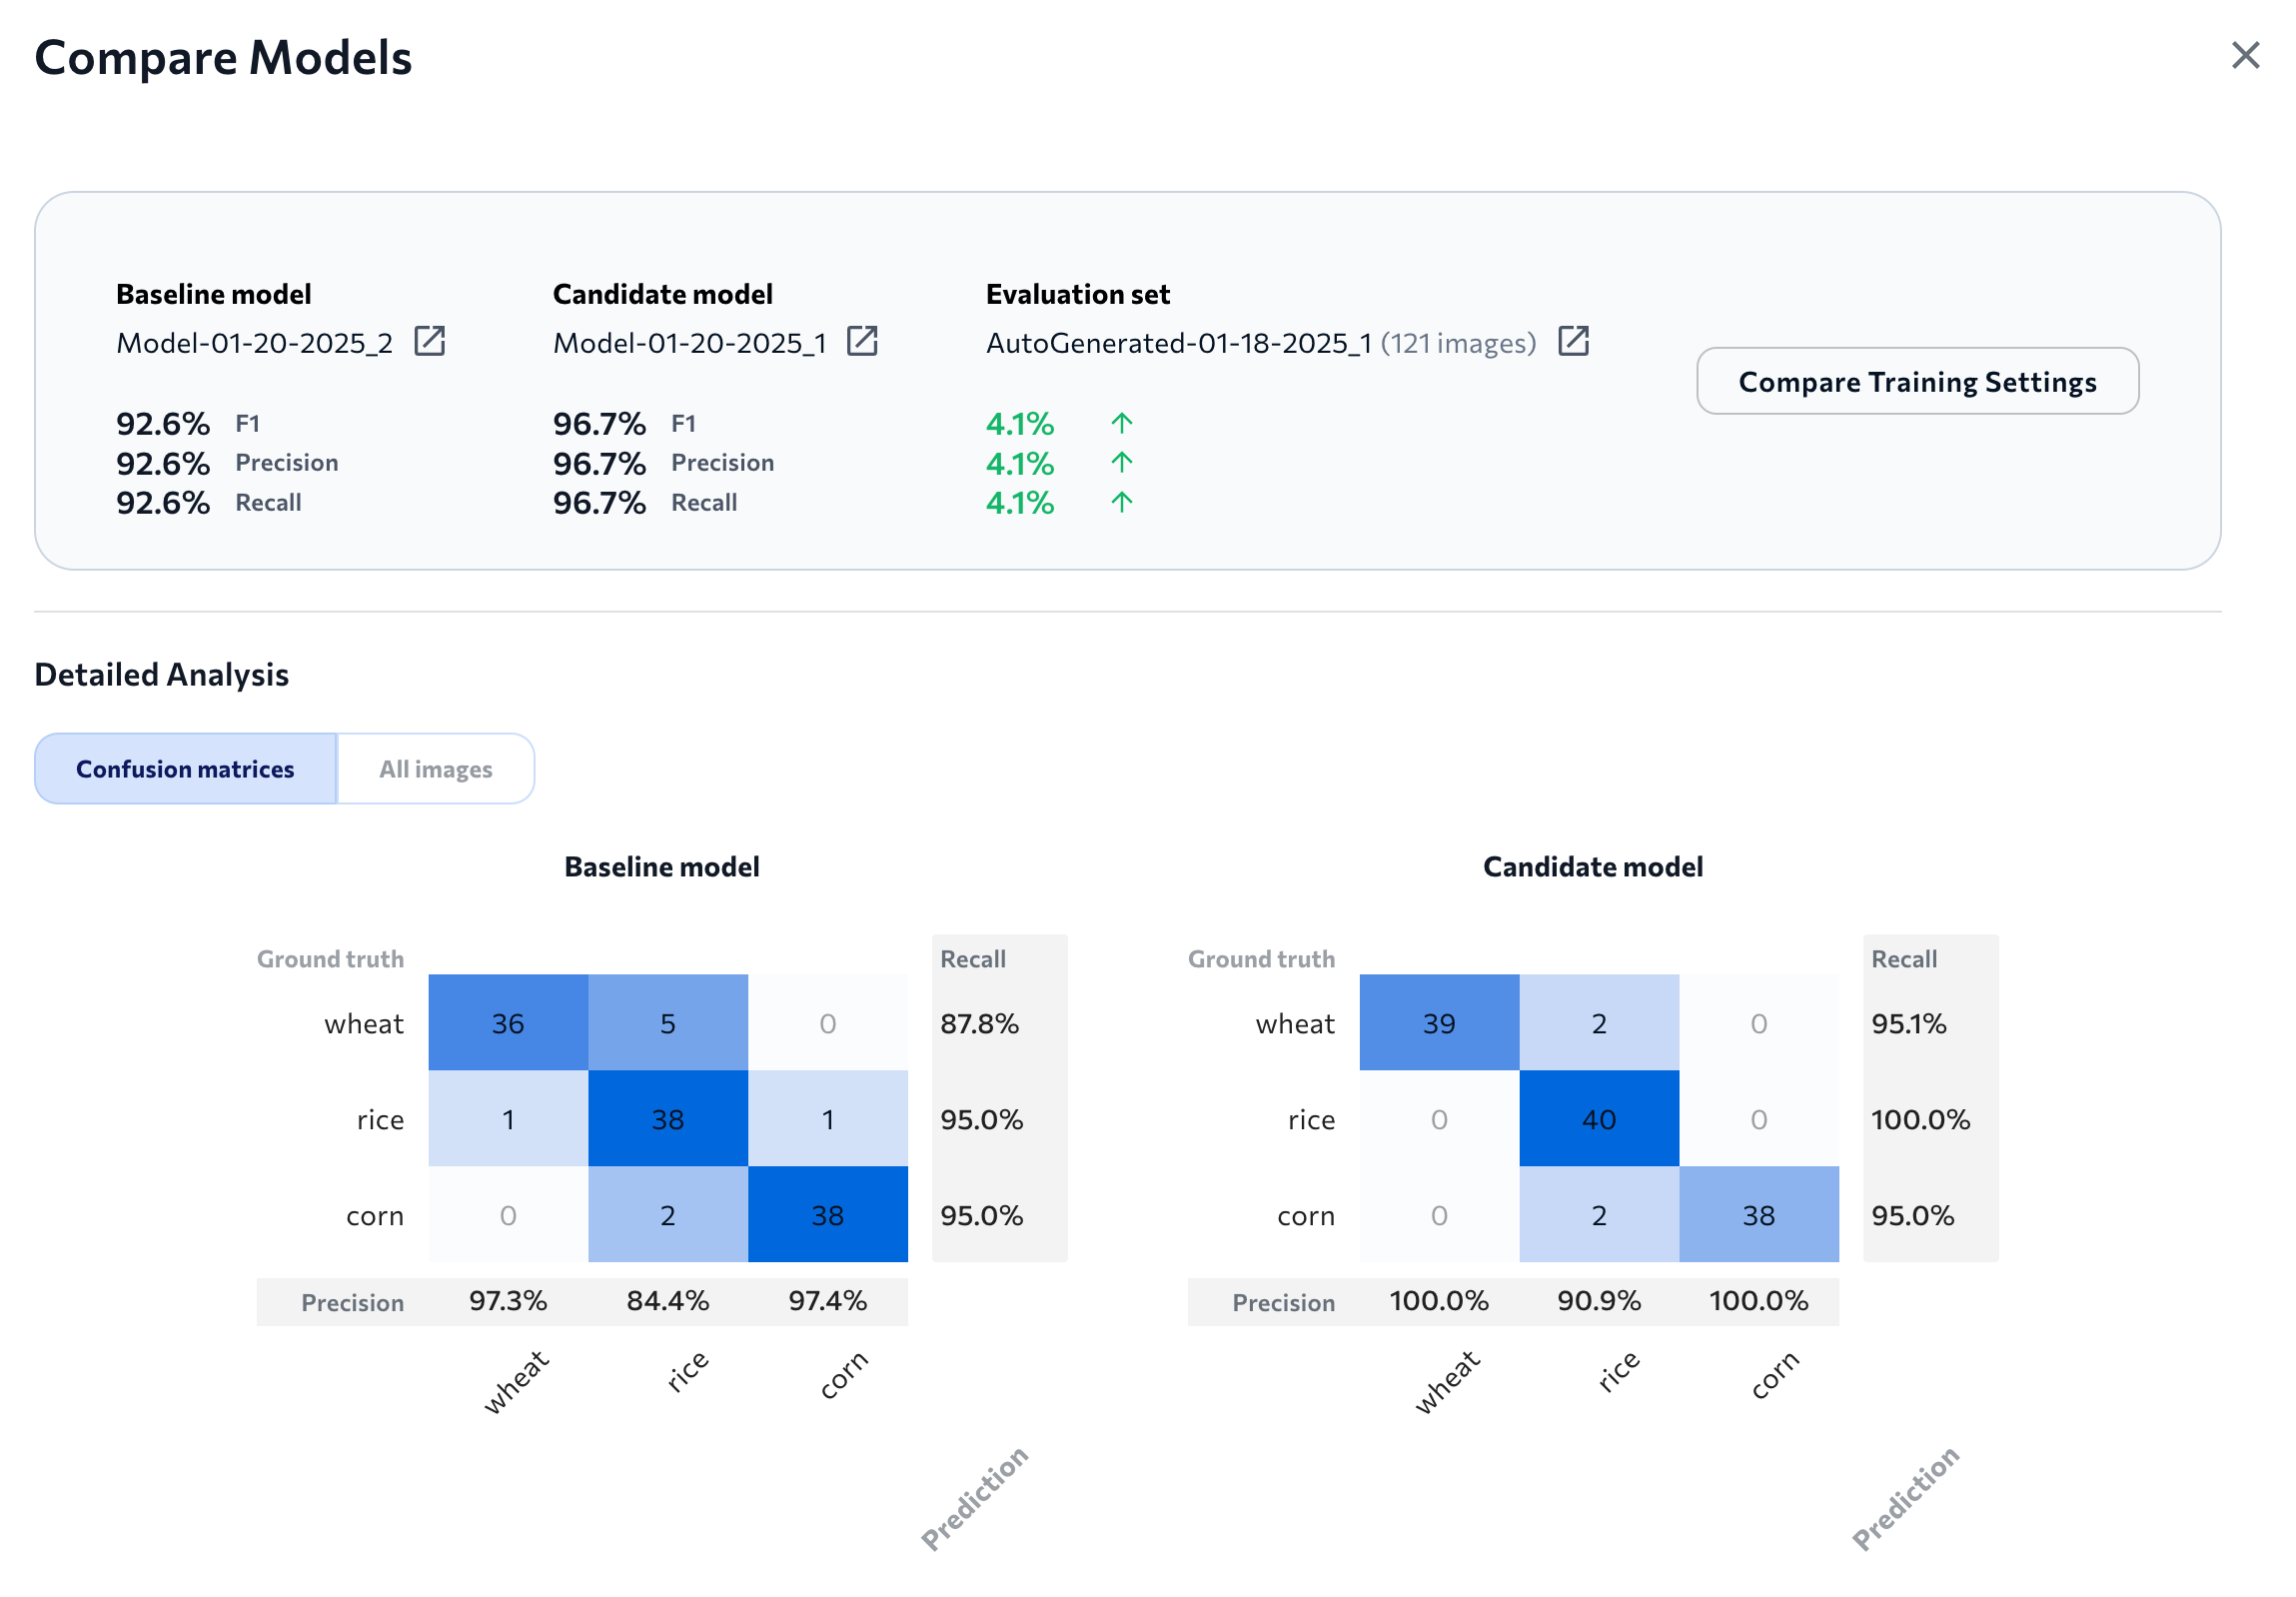
The Compare Models window includes a confusion matrix for both the baseline and candidate model so that you can quickly compare how they performed on each class in the evaluation set.
Each confusion matrix counts ground truth labels versus model predictions. The y-axis represents each ground truth label. The x-axis represents each possible model prediction.
Each cell shows the count of images that correspond to particular ground truth class-predicted class pair. For example, in the image below, the **baseline** model correctly predicted the class "Dolphin" 15 times and misclassified it 7 times, whereas the **candidate** model correctly predicted it 19 times and misclassified it 3 times.
## Confusion Matrices
The Compare Models window includes a confusion matrix for both the baseline and candidate model so that you can quickly compare how they performed on each class in the evaluation set.
Each confusion matrix counts ground truth labels versus model predictions. The y-axis represents each ground truth label. The x-axis represents each possible model prediction.
Each cell shows the count of images that correspond to particular ground truth class-predicted class pair. For example, in the image below, the **baseline** model correctly predicted the class "Dolphin" 15 times and misclassified it 7 times, whereas the **candidate** model correctly predicted it 19 times and misclassified it 3 times.
 For detailed information about confusion matrices and their correspoding Precision and Recall scores, go to [Performance Report](./performance-report).
## Compare All Images
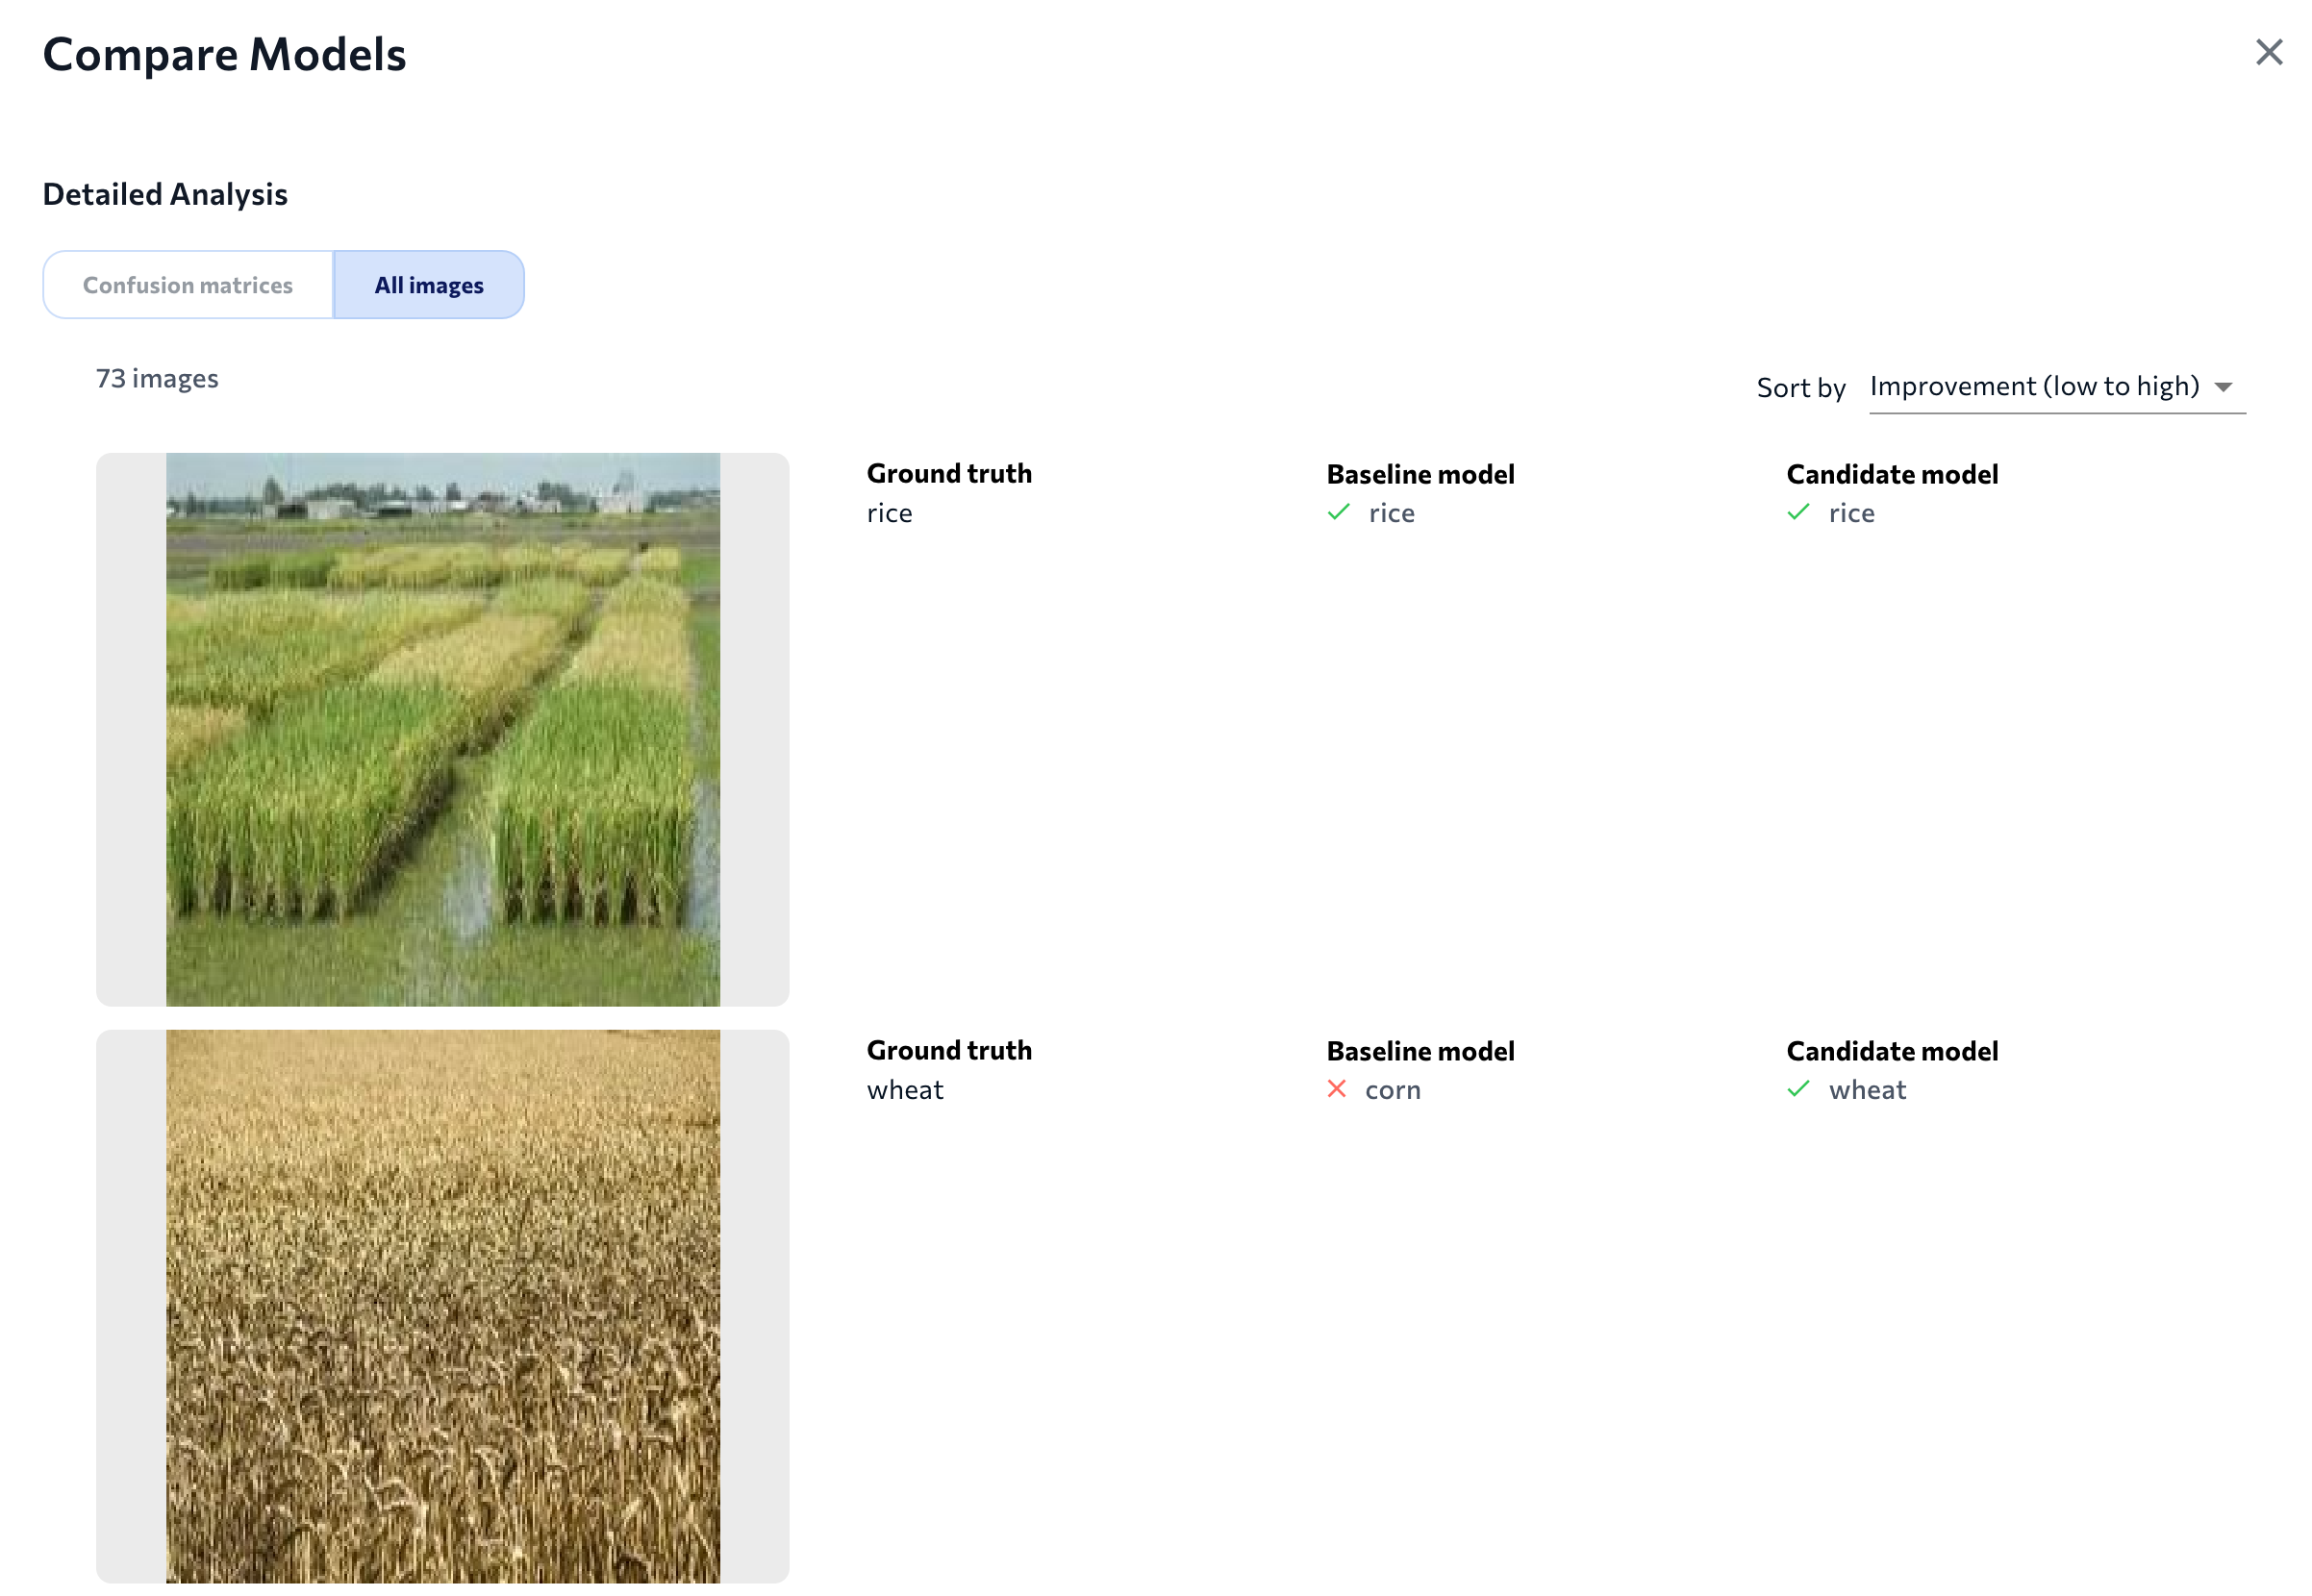
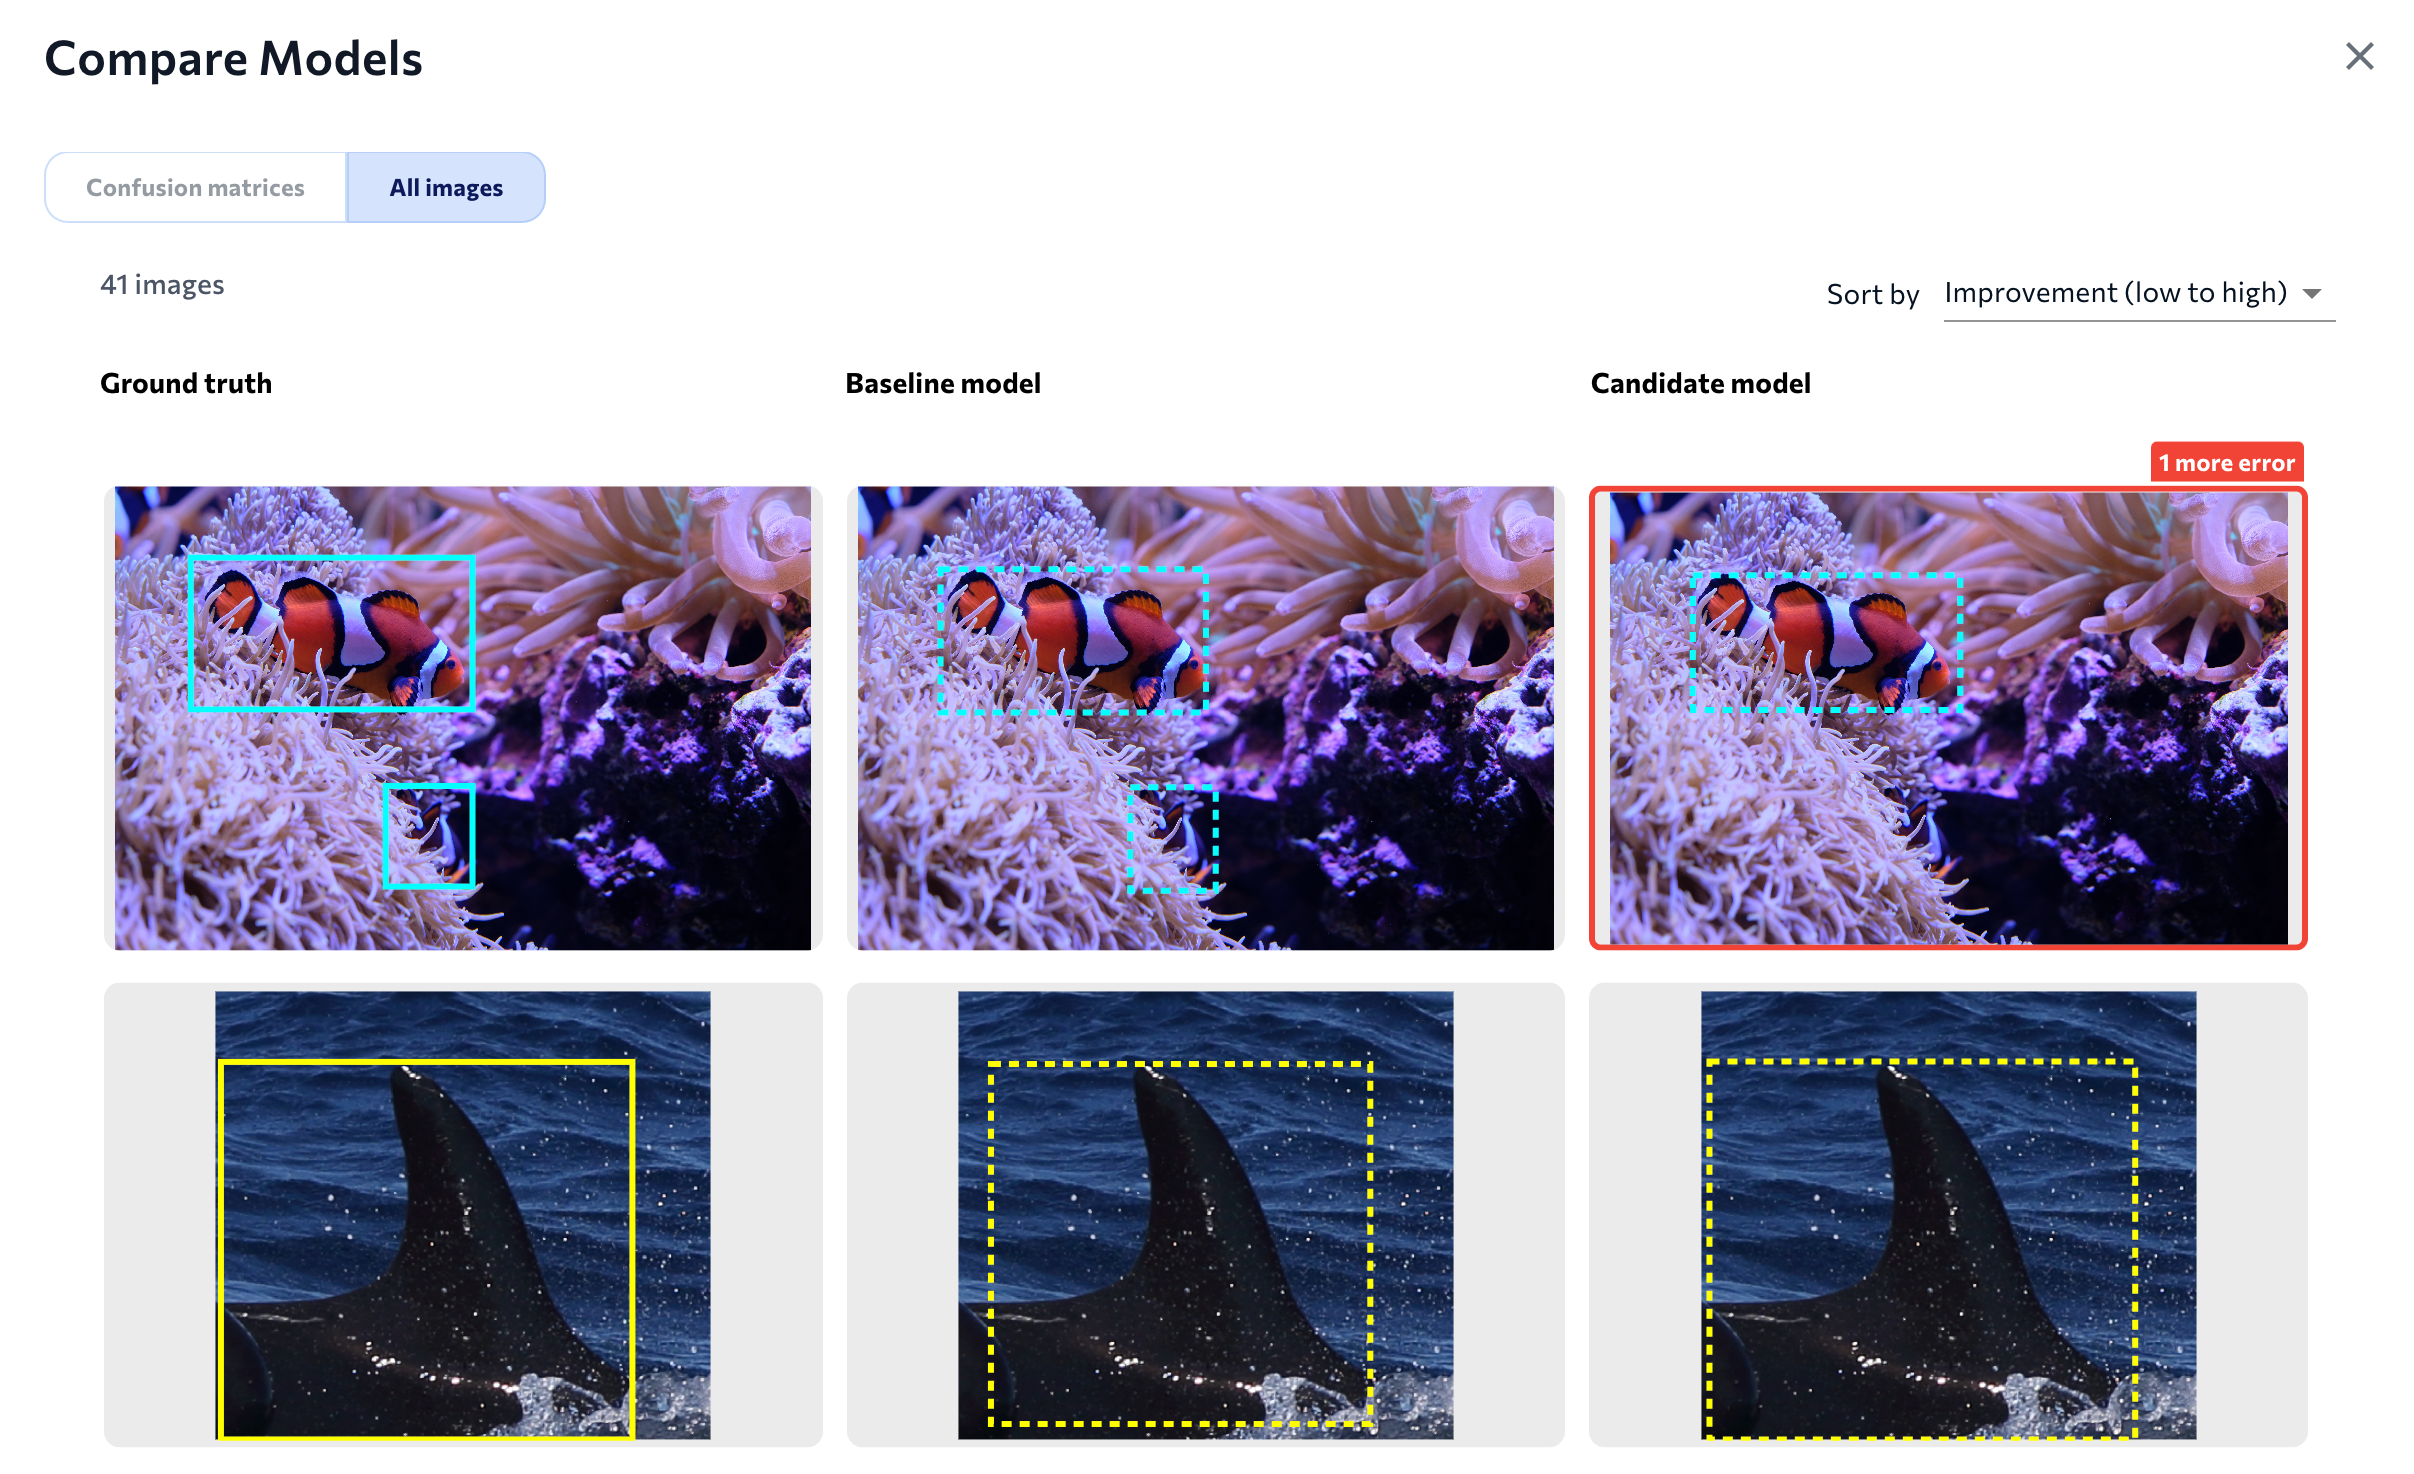
Click **All Images** to see a visual comparison of all images. This shows three versions of each image in the evaluation dataset:
* **Ground truth**: The original image with the ground truth (labels) that you added.
* **Baseline model**: The predictions of the candidate model.
* **Candidate model**: The predictions of the candidate model. LandingLens highlights an image if the candidate model performed better or worse than the baseline for that specific image.
For detailed information about confusion matrices and their correspoding Precision and Recall scores, go to [Performance Report](./performance-report).
## Compare All Images
Click **All Images** to see a visual comparison of all images. This shows three versions of each image in the evaluation dataset:
* **Ground truth**: The original image with the ground truth (labels) that you added.
* **Baseline model**: The predictions of the candidate model.
* **Candidate model**: The predictions of the candidate model. LandingLens highlights an image if the candidate model performed better or worse than the baseline for that specific image.
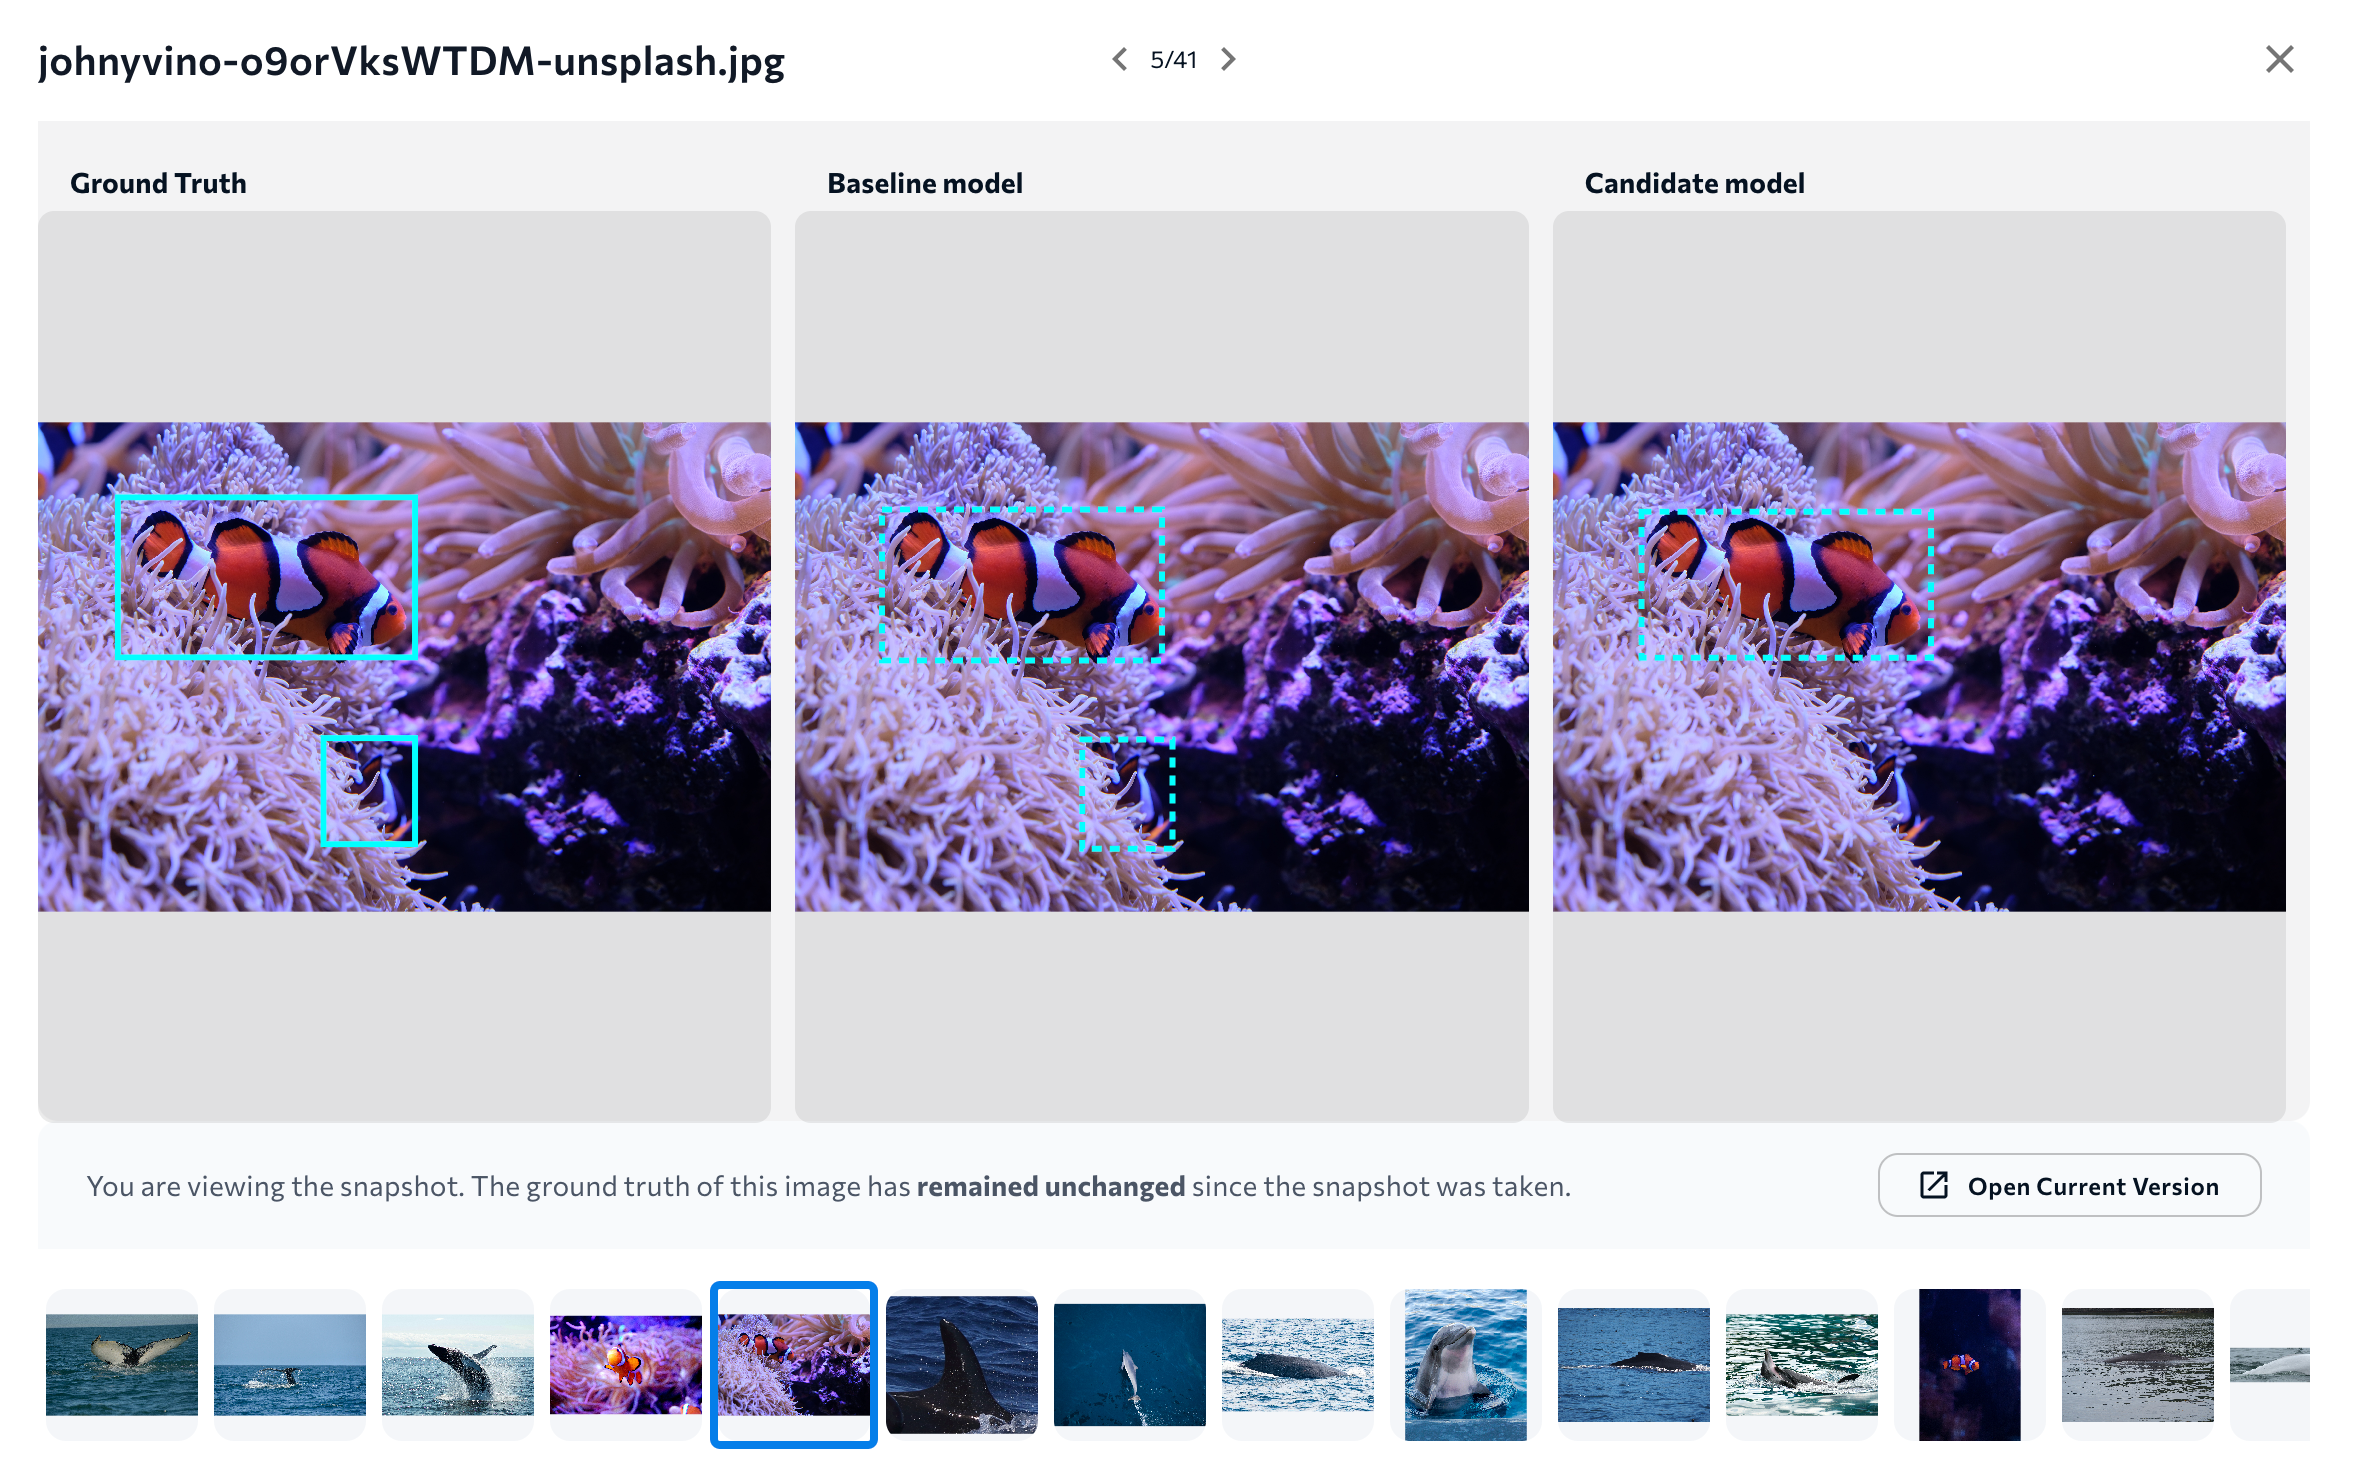
 Click a set of images to see more information about those images.
 ### Compare All Images - Classification and Anomaly Detection
Because classes are assigned to an entire image in Classification and Anomaly Detection projects, it doesn't make sense to show the predictions as an overlay. Therefore, LandingLens shows the images and lists the ground truth and predictions next to the images.
### Compare All Images - Classification and Anomaly Detection
Because classes are assigned to an entire image in Classification and Anomaly Detection projects, it doesn't make sense to show the predictions as an overlay. Therefore, LandingLens shows the images and lists the ground truth and predictions next to the images.